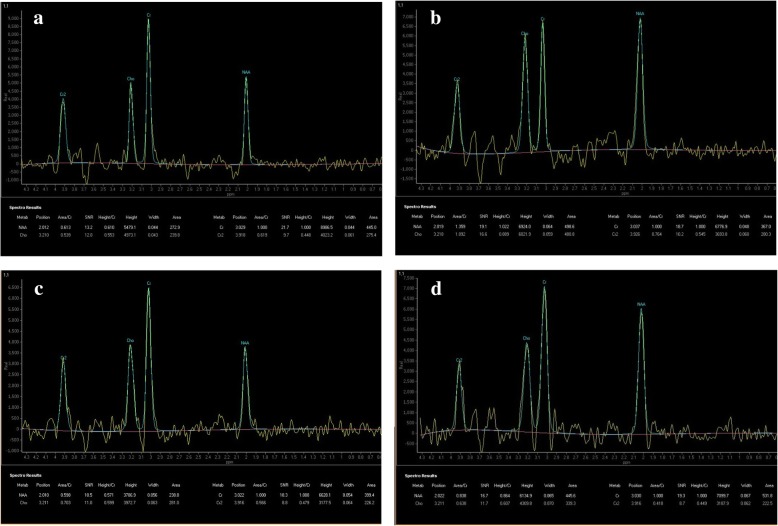
Fig. 2.
shows the MR spectra that were obtained from a 67 years old female with a subsequent clinical diagnosis of probable MSA-C and the spectroscopy from a follow up study. These spectra show the initially markedly reduced NAA level within the vermis relative to the degree of atrophy and normal values returned from the hemisphere that contrast with the rapidly declining levels from the hemisphere at follow up one year later. There was a subtle hot cross bun sign visible on the follow up cross sectional T2 weighted imaging at the time of the follow up imaging and spectroscopy. a and b are the spectra obtained at presentation from the vermis and right cerebellar hemisphere respectively. c and d are the spectra obtained at follow up one year later from the vermis and right cerebellar hemisphere respectively

