Fig. 5.
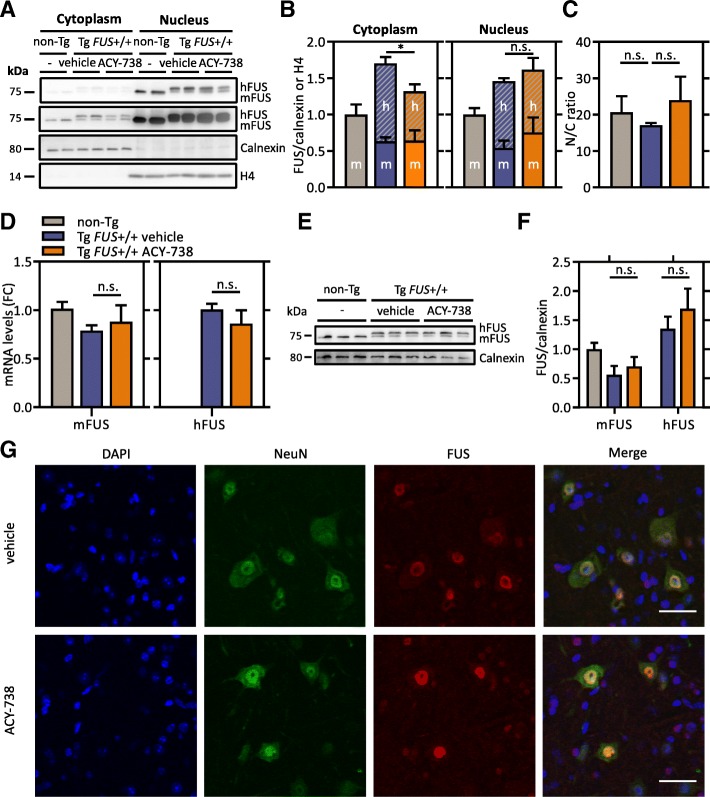
ACY-738 reduces cytoplasmic FUS levels in Tg FUS+/+ mice. a Nuclear-cytoplasmic fractionation of spinal cord tissues of P60 non-Tg controls, vehicle- and ACY-738-treated Tg FUS+/+ mice. The top 75 kilodalton panel is a lower contrast image of FUS, the second 75 kilodalton panel is a higher contrast image of FUS. Calnexin was used as a cytoplasmic marker and as reference for equal loading. Histone 4 was used as a nuclear marker and as reference for equal loading. b Quantification of the ratio of murine FUS (mFUS) and human transgene FUS (hFUS) to calnexin (cytoplasm) or histone 4 (nucleus) and normalization to non-Tg controls. n = 4, One-way ANOVA with Tukey’s multiple comparisons test. c Nuclear-to-cytoplasmic ratio calculated from absolute total FUS levels in both fractions. n = 4, One-way ANOVA with Tukey’s multiple comparisons test. d Quantitative PCR analysis of mRNA expression levels of murine and human FUS in the spinal cord of P60 non-Tg controls, vehicle- and ACY-738-treated Tg FUS+/+ mice, with Ap3b1 and Mon2 as reference genes and normalization to non-Tg controls. Fold change compared to non-Tg controls (FC). n = 6, Student’s t-test. e Western blot of FUS in the spinal cord of P60 Tg FUS+/+ mice and non-Tg controls. Calnexin levels were used as reference for equal loading. f Quantification of the ratio of Hdac1, Hdac2 and Hdac3 to calnexin and normalization to non-Tg controls. g Immunostaining of FUS and neurons (NeuN) in spinal cord of P60 vehicle- and ACY-738-treated Tg FUS+/+ mice. Scale bar = 35 μm. *P < 0.05. Data are presented as means ± SEM

