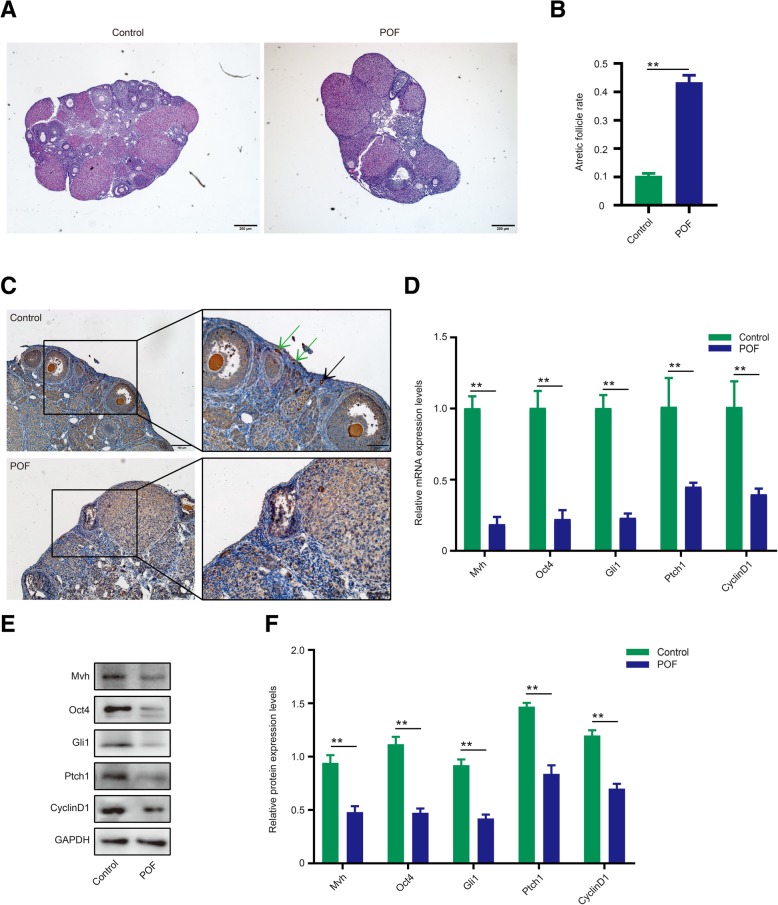
Fig. 3.
Pathological ovaries exhibited a decline in Hh pathway activity. a HE staining of a normal ovary and POF ovary. Bar is 200 μm. b The ratio of atretic follicles of normal and POF ovaries. c IHC shows that the Mvh-positive follicles and FGSCs dramatically disappeared in the POF model; green arrows are FGSCs, and black arrow represents primordial follicles, the scale is 100 μm. d–f mRNA and protein expression levels of Mvh, Oct4, Gli1, Ptch1, and Cyclin D1. *p < 0.05 and **p < 0.01

