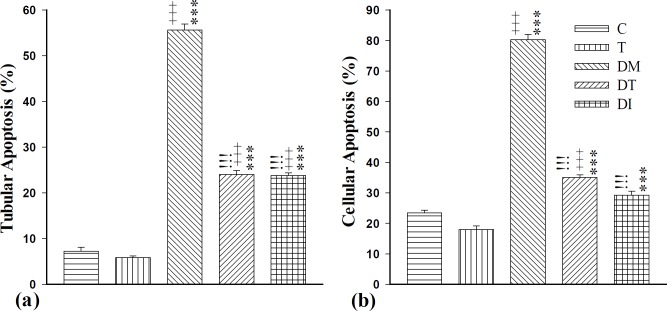
Figure 4.
(a) Tubular apoptosis (AI-1) (%) and (b) cellular apoptosis (AI-2) (%) levels in control group (C), healthy animals that received troxerutin (T), diabetic animals (DM), diabetic animals that received troxerutin (DT) and diabetic animals that received insulin (DI) (n=6 in each group). +++ p<0.001 shows statistical differences between control and different groups. *** p<0.001 shows statistical differences between troxerutin and different groups. iii p<0.001 shows statistical differences between DT and DI with DM group

