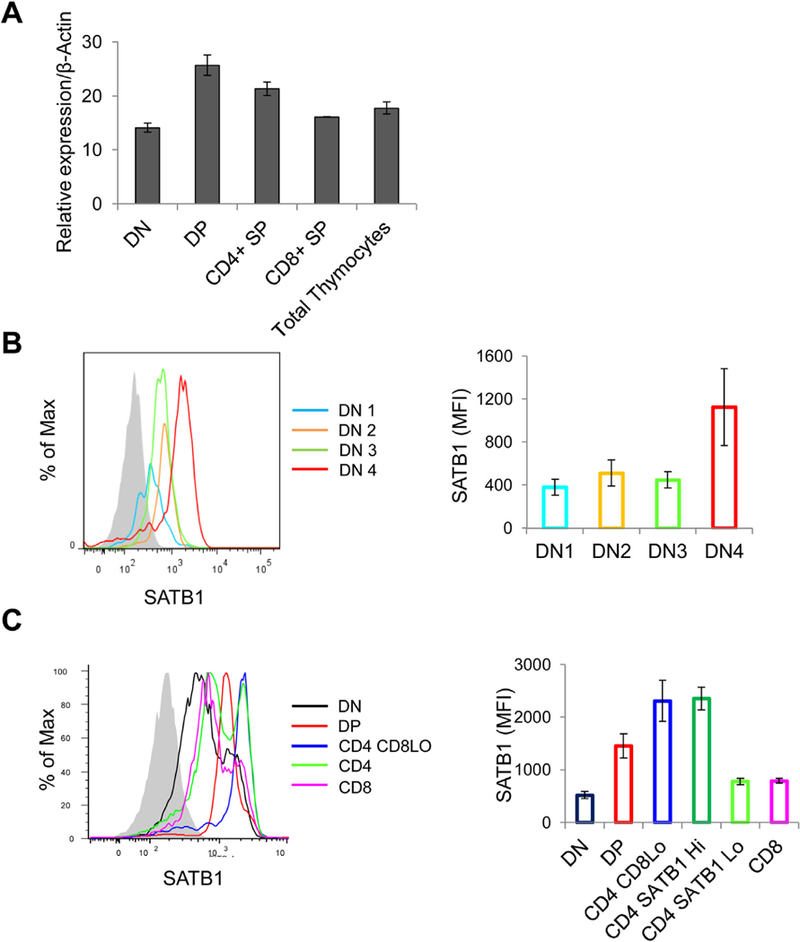
Fig. 1.

SATB1 expression is induced during thymocyte development. (A) Bar graph representing quantitative RT-PCR analysis of SATB1 expression in mouse thymocytes sorted based on anti-CD4 and anti-CD8 staining. (B) Mouse thymocytes were stained with lineage (Lin) specific factors along with CD44, CD25 and SATB1. The Lin –ve population is analyzed for CD44 and CD25 to differentiate into DN1-DN4 population and each subset is analyzed for SATB1 as represented in the histogram and bar graph. (C) SATB1 expression levels in various thymocyte subsets based on CD4 and CD8 co-receptors were quantified using flow cytometry analysis and corresponding histogram and bar graphs are plotted. Error bars represent standard deviation from three independent experiments.
