
Fig. 2.
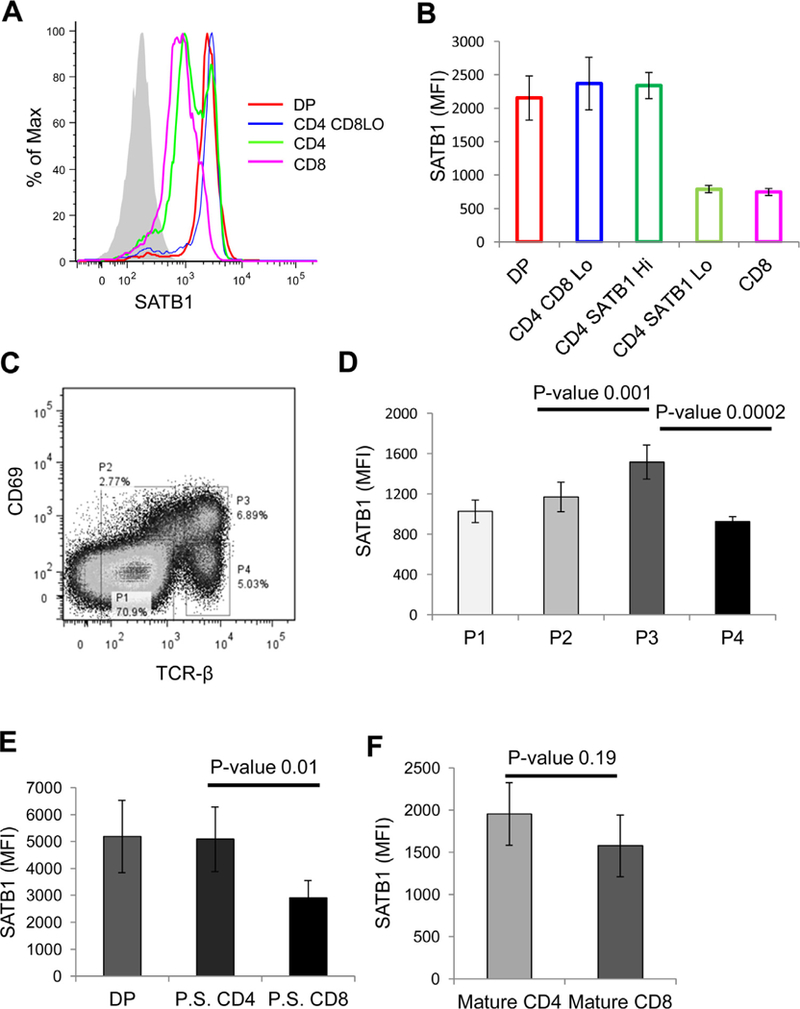
SATB1 expression is developmentally regulated during thymocyte development. (A) Mouse thymocytes were analyzed for SATB1 expression in TCR-βHI thymocyte subsets based on CD4 and CD8 as represented in the histogram, (B) represents the MFI values of SATB1 expression in thymocyte subsets as shown in (A). (C) Mouse thymocytes were stained with CD69 and TCR-β to distinguish them into developmental stages based on positive selection. Population 1 represents thymocytes that have not undergone positive selection. Population 2 represents thymocytes undergoing positive selection. Population 3 refers to thymocytes that have undergone positive selection and population 4 thymocytes represents mature thymocytes. (D) Bar graph represents SATB1 expression in each population represented in (C) and error bars represent standard deviation calculated from n = 5. (E) SATB1 expression in DP, CD4 and CD8 subpopulations of thymocytes that have undergone positive selection (population 3). (F) Bar graph denotes SATB1 expression in CD4 and CD8 thymocytes of mature subset (population 4). P-values were calculated using T-test (n = 5).