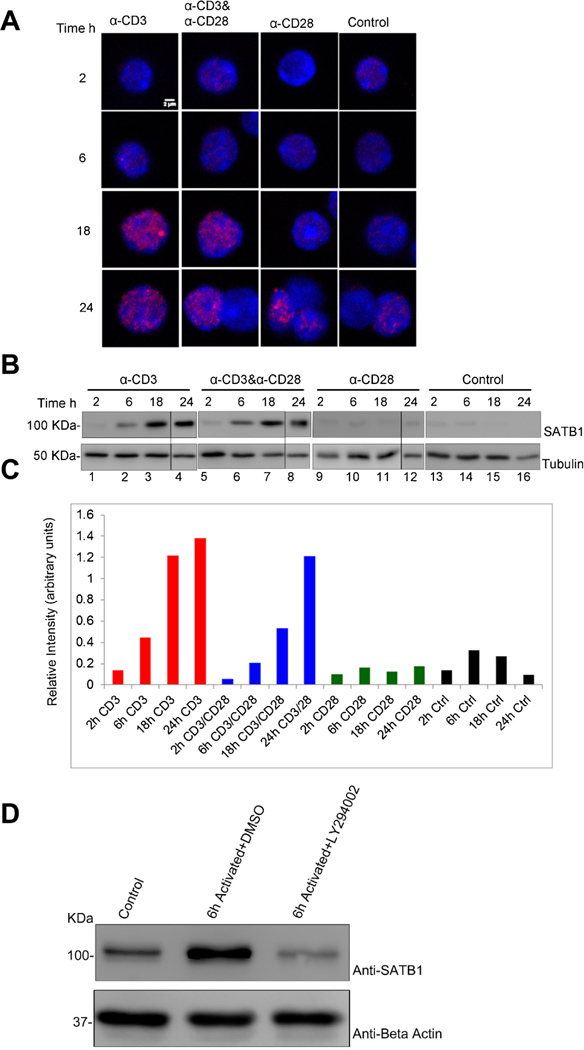
Fig.4.

SATB1 is induced in peripheral CD4Tcells upon TCR signaling.(A) Immunofluorescence images of CD4T cells activated in presence of plate-boundanti-CD3,anti-CD28, anti-CD3/CD28 or control conditions (without antibody) for2h,6h,18h and 24h. Cells were stained with DAPI (blue) and SATB1 (red). (B) Immunoblot analysis for SATB1 expression in CD4+ T cells cultured under similar conditions as mentioned in (A). β-Actin blots served as loading control. (C) Bar graph represents densitometric analysis of immunoblots for SATB1 expression using Image-J software (NIH). (D) CD4+ T cells were treated with PI3K inhibitor (LY2940002) that affect downstream TCR signaling and analyzed for SATB1 expression by Western blot. (E) Bar graph represents densitometric analysis of immunoblots of three independent experiments including that from (D). Error bars represent standard deviation calculated from n = 3.
