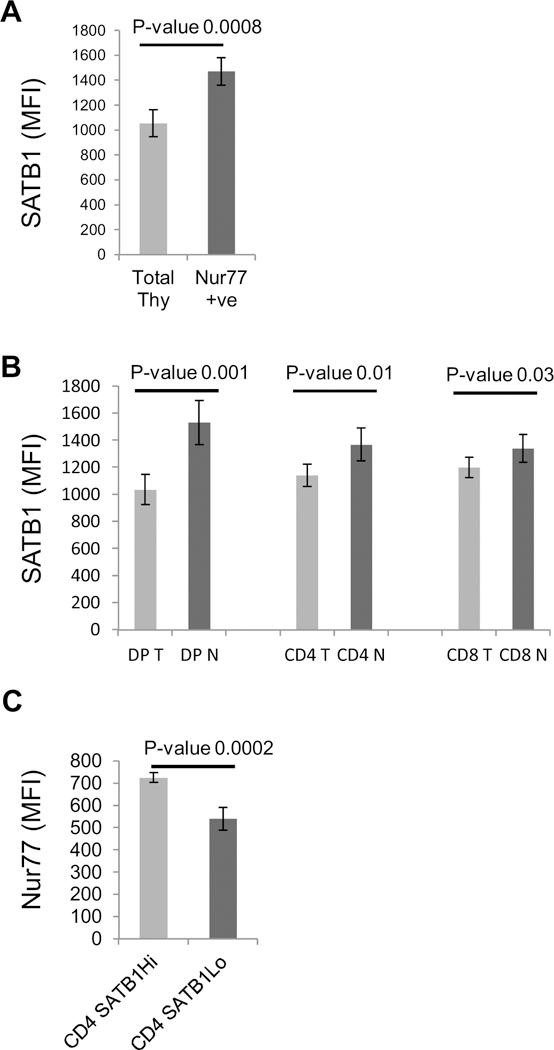
Fig. 5.

SATB1 expression correlates with that of Nur77 in developing thymocytes. A. Mouse thymocytes were stained with Nur77 and SATB1 and analysed for expression of SATB1 in total and Nur77+ve thymocytes. B. Expression pattern of SATB1 individual DP, CD4 and CD8 subsets of total (T) and Nur77+ve gated population (N). C. Nur77 expression in SATB1Hi and SATB1Lo populations of CD4 thymocytes. Error bars represent standard deviation and p values calculated using student’s T Test (n = 5).
