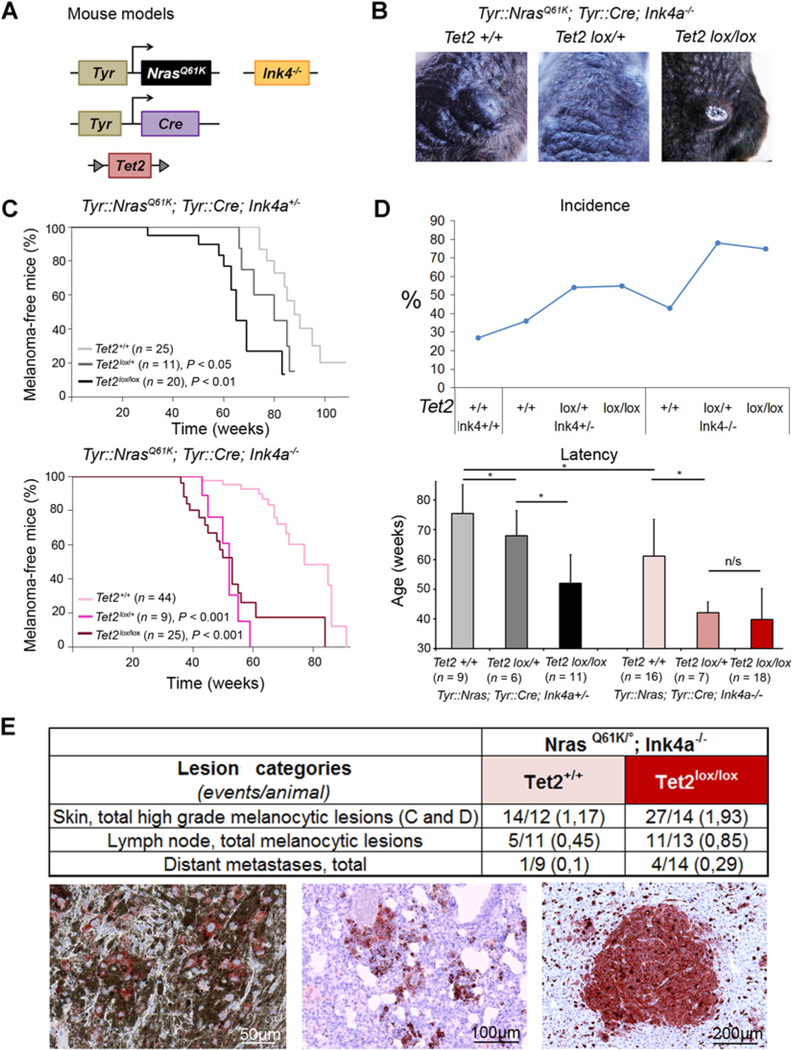
Figure 2.
Tet2 loss cooperates with oncogenic NRas and p16Ink4a depletion to generate melanoma in mice. A, Schematic representation of the transgenes. The Nras oncogene is expressed and Tet2 expression is abolished in the melanocyte lineage of mice with the Ink4a+/− or Ink4a−/− background. B, Identification of tumor-bearing mice by visual inspection. In mice expressing oncogenic Nras and not Ink4a, independently of the Tet2 genetic status, melanomas appeared mainly on the back. C, Tumor-free survival curves are shown for the effect of Tet2 depletion in Nras-oncogene–expressing Ink4a+/− (top) and Ink4a−/− mice (bottom). P values resulting from the log-rank test indicated statistically significant difference as compared with Tet2+/+ controls. In mice with the Ink4a+/− background, melanoma-free survival differed significantly between Tet2lox/lox and Tet2lox/+ mice, P < 0.05. This was not the case of mice with the Ink4a−/− background. D, Graph of incidence indicating the proportions of Nras-mutant mice developing a C or D skin lesion (top) and graph indicating the average time of tumor appearance for each genotype (bottom). t test resulting P values are indicated as * when <0.05. n/s, nonsignificant. E, Anatomo-histologic analysis of samples showing that Tet2 deficiency leads to an increased number of events (type-C or -D skin lesions and metastases) per animal having the NrasQ61K; Ink4a−/− background (top). Representative IHC images of gp100 are shown and scale bars are indicated at the bottom right of each picture: subcutis type-D lesion (left), lung metastasis (middle), and liver metastasis (bottom right).

