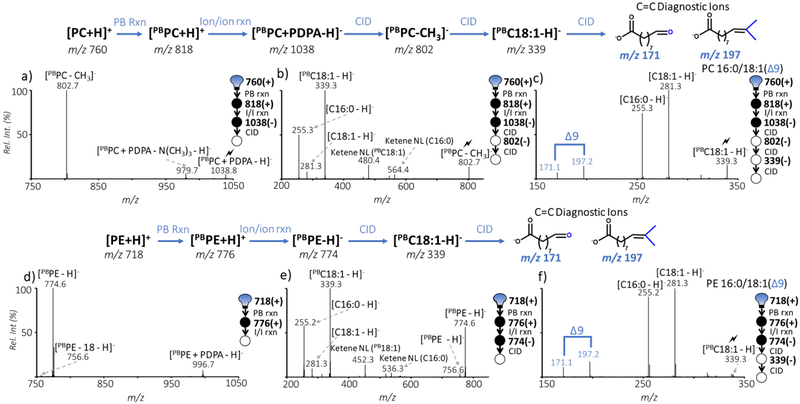
Fig. 2:
Sequence of events post-ion/ion reaction between GP standard cations and PDPA dianion; a) Ion trap CID of [PBPC + PDPA - H]−; b) Ion trap CID of [PBPC - CH3]−; c) Subsequent ion trap CID of [PBC18:1 - H]− d) Result of ion/ion reaction between [PDPA-2H]2− and [PBPE + H]+; e) Ion trap CID of [PBPE - H]−; f) Subsequent ion trap CID of [PBC18:1 - H]−; Schematics in a-c and d-f are layouts of the process for determining the GP structure. CID of a target ion is depicted by a lightning bolt ( ). Cations and anions are represented by (+) or (−), respectively.

