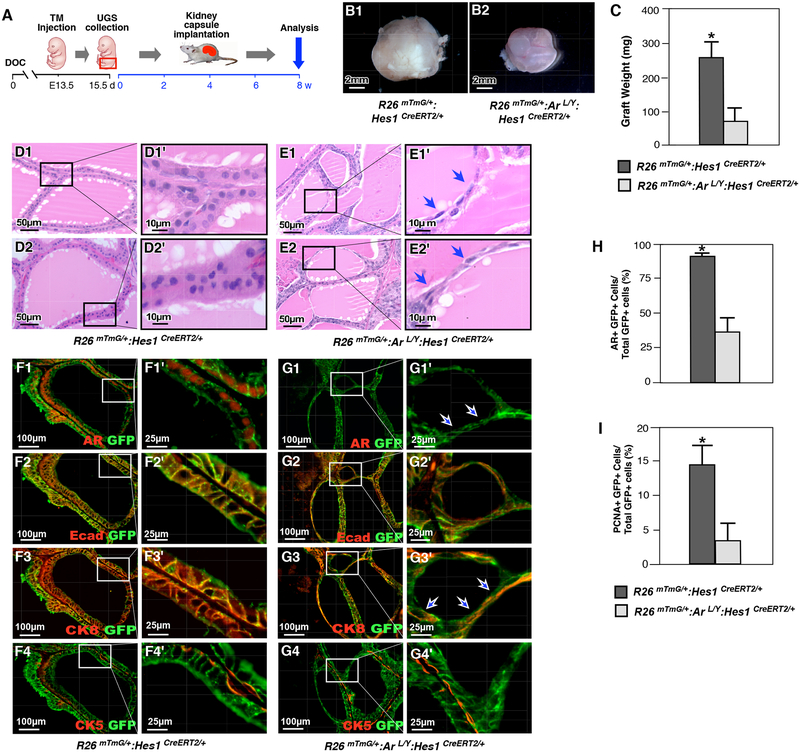
Figure 4. Deletion of AR in Hes1-expressing cells during embryonic development impedes prostate formation.
(A) Schematic of experimental timeline for TM induction, UGS isolation, kidney capsule transplantation and analysis of xenografted urogenital tissues. (B) Gross images of representative xenografts from UGS tissue isolated from R26mTmG/+: Hes1CreERT2/+ (B1) or R26mTmG/+: ArL/Y: Hes1CreERT2/+ (B2) mice. (C) Graphical representation of xenograft weight from different genotype mouse grafts as labeled above. Please also see Supplemental Table 4 in the Supplemental data file. (D) and (E) Representative H&E staining of tissue sections from xenografts of R26mTmG/+: Hes1CreERT2/+ or R26mTmG/+: ArL/Y: Hes1CreERT2/+ mice. Blue arrows indicate flattened epithelial cells. (F) Co-IF analyses of graft tissues of R26mTmG/+: Hes1CreERT2/+ with GFP and different antibodies, AR (F1), E-cadherin (F2), CK8 (F3) or CK5 (F4) in xenografts. (G) Similar Co-IF analyses with graft tissues of R26mTmG/+: ArL/Y: Hes1CreERT2/+ as described in (F). White arrows indicate AR-deleted flattened cells. (H) Quantification of AR and GFP co-expressing cells in xenografts from different genotype mouse tissues as indicated above. Please see Supplemental Table 5 in the Supplemental data file. (I) Quantification of PCNA and GFP co-expressing cells in xenografts from different genotype mouse tissues as indicated above. Please see Supplemental Table 6 in the Supplemental data file. Scale bars: 2mm (4B1–2); 50μm, or 10μm in magnified views (4D-E); 100 μm, or 25 μm in magnified views (4F-G). Results are mean +/− SD of at least three independent samples per group. *: P<0.05.

