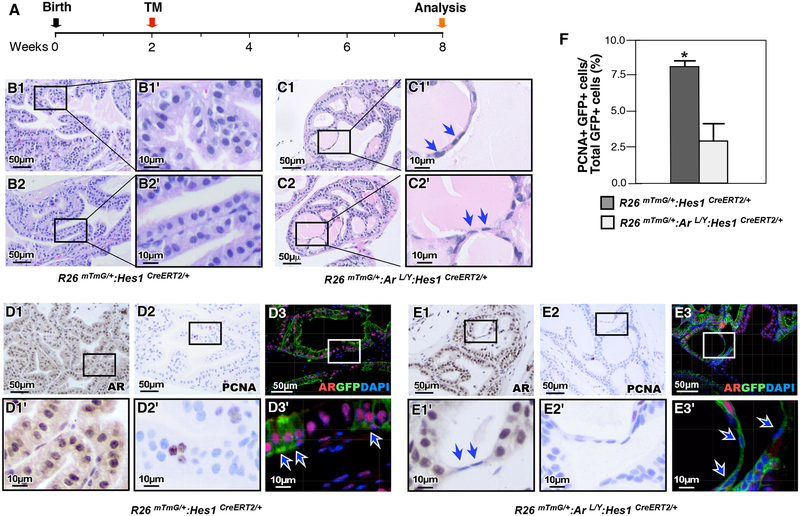
Figure 5. Deletion of AR expression in prepubescent Hes1-expressing cells impairs prostate growth.
(A) Schematic of experimental timeline for tamoxifen induction and analysis of prostatic tissues. (B-C) Representative H&E staining of prostate tissue sections from different genotypes mice as indicated above. Blue arrows indicate atrophic flattened epithelial cells resulting from loss of AR expression. (D) Immunohistochemical (IHC) and IF analyses of prostate tissues isolated from R26mTmG/+: Hes1CreERT2/+ mice using antibodies indicated above, AR (D1), PCNA (D2), or AR and GFP (D3). White arrows indicate AR and GFP co-expressing cells. (E) Similar analyses of prostate tissues isolated from R26mTmG/+: ArL/Y: Hes1CreERT2/+ mice were performed as indicated in D section. Arrows indicate AR-deleted flattened cells. (F) Quantification of PCNA and GFP co-expressing cells in prostate tissue sections from each genotype. Please also see Supplemental Table 7 in the Supplemental data file. Scale bars: 50 μm, or 10 μm in magnified views. Results are mean +/− SD of at least three independent samples per group. *: P <0.05.

