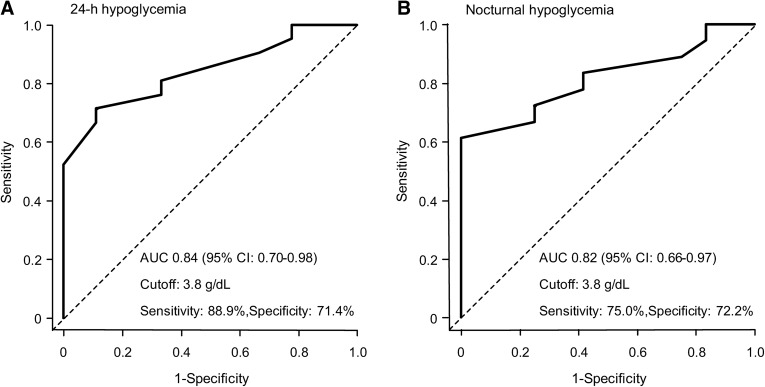
Fig. 1.
Receiver-operating characteristic (ROC) curve for 24-h hypoglycemia (a) and nocturnal hypoglycemia (b) in serum albumin levels. In each of a, b, at the cutoff value of 3.8 g/dl, the prediction ability is highest, the sensitivity is 88.9/75.0%, the specificity is 71.4/72.2%, and the area under the curve (AUC) is 0.84/0.82 (95% CI 0.70–0.98/0.66–0.97)

