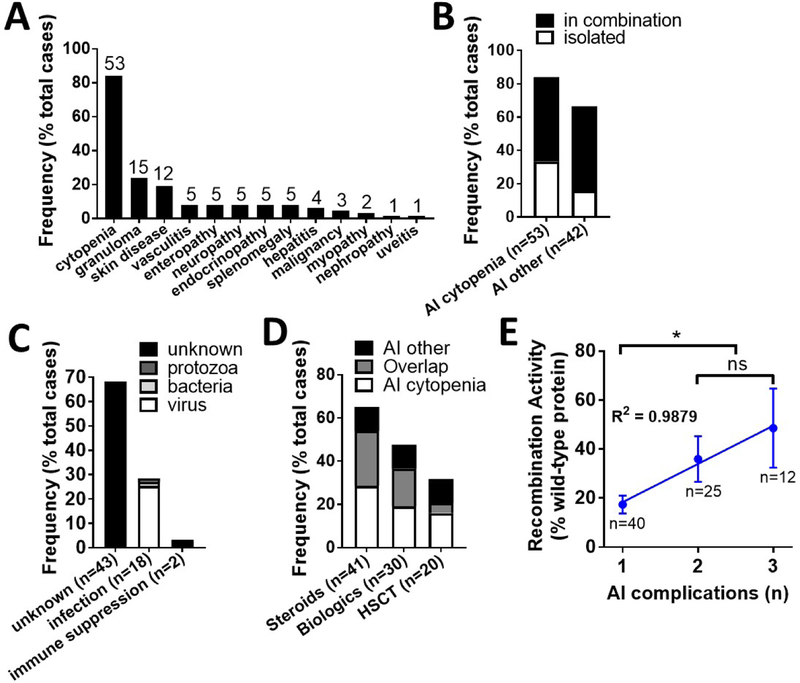
Figure 4. Autoimmune and hyperinflammatory outcomes of curated RAG deficiency database (n=63).
(A) Prevalence of individual autoimmune and hyperinflammatory complications (frequency as % total cases). (B) Occurrence of autoimmune and hyperinflammatory complications in isolation or combination (frequency as % total cases). (C) Clinician-annotated triggers for autoimmune and hyperinflammatory disease development (frequency as % total cases). (D) Burden of treatment for autoimmune and hyperinflammatory complications (frequency as % total cases). (E) Correlation between number of autoimmune complications (cumulative per patient) and recombination activity (average +/− SEM as % wild-type protein), linear regression of mean Y values with R2 shown. Exact patient counts (A-D) and allele counts (E) as shown with statistical difference indicated (ns = not significant; *P <0.05, **P <0.005, ***P <0.0001); autoimmune (AI); hematopoietic stem cell transplant (HSCT).

