Abstract
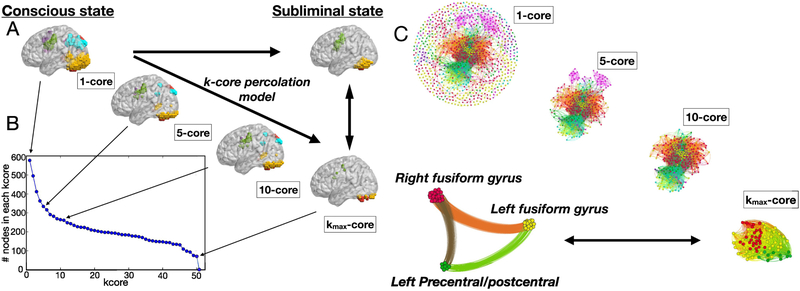
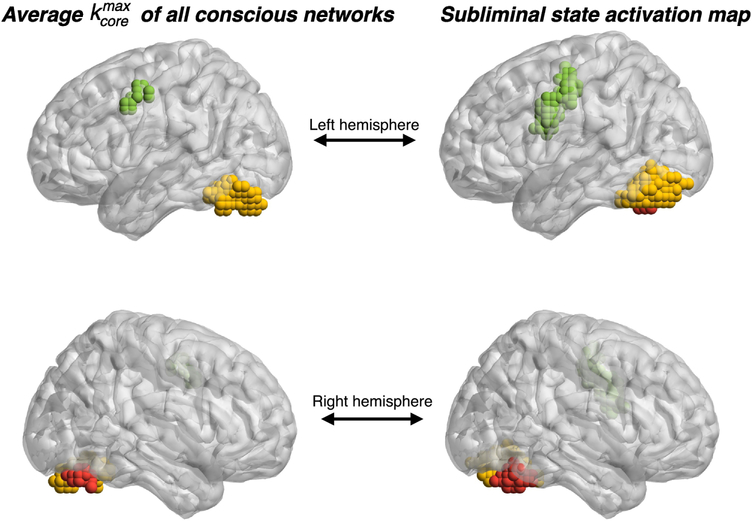
We study the transition in the functional networks that characterize the human brains’ conscious-state to an unconscious subliminal state of perception by using k-core percolation. We find that the most inner core (i.e., the most connected kernel) of the conscious-state functional network (the visual cortex and the left middle frontal gyrus) corresponds to the areas which remain functionally active when the brain transitions from the conscious-state to the subliminal-state. That is, the inner core of the conscious network coincides with the subliminal-state. Mathematical modeling allows to interpret the conscious to subliminal transition as driven by k-core percolation, through which the conscious state is lost by the inactivation of the peripheral k-shells of the conscious functional network. Thus, the inner core and most robust component of the conscious brain corresponds to the unconscious subliminal state. This finding imposes constraints to theoretical models of consciousness, in that the location of the core of the functional brain network is in the unconscious part of the brain rather than in the conscious state as previously thought.
Keywords: Subliminal perception, percolation theory, k-core percolation, brain networks, complex networks
Introduction
The human brain as a natural system has received growing attention. The scientific literature has explored, from a mathematical and theoretical physics perspective, the sensitivity and relevance of different properties of brain topology from a network standpoint [13,20,36,21,39,6,18,10,35,11]. Many scales and levels of detail have been investigated, from completely defined networks of hundreds of neurons in species with particularly small brains [43] to macroscopic summaries of networks up to 100 billion neurons of the mammalian brain [36,35,15,40].
Earlier studies concentrated on the distribution of degree (the number of neighbors on each node), the clustering (the likelihood that co-neighbors of a node will also be neighbors), or the diameter (the typical distance between two nodes of the network) [36,31,6,35]. A second wave of studies has combined these measures together, for instance in the notion of small-world networks [42,18].
Several other statistical markers of networks have been investigated and recently the idea of k-core [32,30] has received substantial attention in network analysis since it provides a topological notion of the structural skeleton of a network [17,8,1,21,24]. Theoretical analyses [29] have shown that, the k-core may also be an indicator for the stability of complex biological systems. Of particular importance for the scope of this paper, is the analysis done in [21,26] which demonstrate that the k-core of the network, is located in the posterior regions of the brain.
In this work we use network measures as a tool to inquire on one of the most challenging questions in brain science: the signatures of conscious and subliminal perception. We use the notion of k-core derived from theoretical physics as a fundamental measure of centrality and robustness within a network, to address the question arising from brain science concerning what brain markers characterize the conscious → subliminal transition.
Recent theoretical results [29] highlight how the resilience of neural dynamical systems is controlled by the strength of the interaction couplings and that, furthermore, the most robust part of the system under interaction coupling change is the maximum k-core of the corresponding network. This study inspired us to investigate the maximum k-core of the network for the system under study and verify if it has a neuroanatomical correspondence. If one can give meaning to such robust subset of the network, then the k-core percolation would represent a meaningful method for the modelling of the corresponding transition.
We build on a classic study of human brain activations performed by Dehaene et al. [1]. These experiments measure, through functional Magnetic Resonance Imaging (fMRI), participants that either record seeing an image flashed at millisecond intervals on a computer screen in front of them (conscious state), or they do not (subliminal state). We build the functional brain networks of the obtainedconscious state based on temporal similarity of activations.
The main theoretical question that we then ask is how the transition from conscious to subliminal state can be modeled in terms of network theory and what subset of the conscious-state network describes the final state of this transition to the subliminal state. We contrast two possible hypothesis. A natural idea is that the k-core decomposition method may index the regions which are more relevant for conscious processing. This intuition comes from several theoretical studies of the neural substrate of consciousness advanced by Dehaene, Tononi and collaborators [12,37], which argue that vast broadcasting, dense and flexible connectivity may be a central feature of consciousness. Differently, several psychological theories, most notably deriving from the work of Benjamin Libet [28], have implied that subliminal processing provides a kernel for all thought. In this view, consciousness is ‘merely’ a read-out of this vast and robust cascade of processes.
Discriminating between these two theories requires to understand whether the k-core of a set of conscious activations is associated with specific nodes of the network that make this activation conscious or, instead, with a subliminal stream which serves as a structural core for subsequent conscious activations. Our analysis supports the latter hypothesis: the functional network which models the subliminal-state of the brain corresponds to the maximum k-core of the more extended functional network which models the conscious-state.
The article is organized as follows. First we give an illustration of the experiments, performed by Dehaene et al. [1] from where we analyze all data and a corresponding definition of conscious- and subliminal-state of the brain. In the Methods Section, we describe the methodology employed to construct functional brain networks of the conscious-state and introduce the concept of k-core decomposition as a trimming process to identify network structures. The Results Section discusses the results and shows that the nodes in the maximum k-core of the conscious-state network correspond to the subliminal-state of fMRI activation, both at the brain module and node level. In the Discussion Section we elaborate on the interpretation of our results by discussing theory of the k-core developed [29] on the role of the k-core as indicator of network robustness. Here we alsodebate our findings in the light of the consciousness theories of Libet and Dehaene- Tononi. In the Conclusions Section summarizes the study and draws the conclusions.
Data
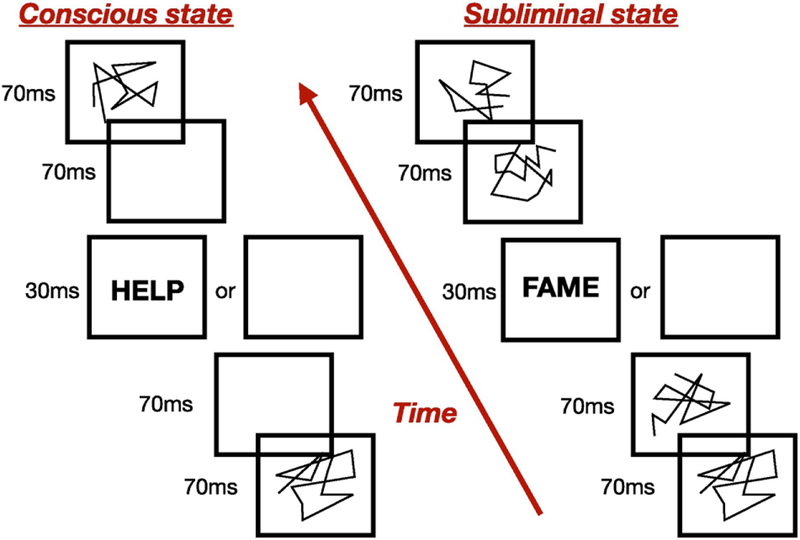
The data that we use in our study and analysis were collected by Dehaene et al. [1] and are briefly explained next. In the investigation discussed in [1], a subject endures two different experiments for a specific time interval. In this time frame four letter words are presented to a participant which undergoes fMRI screening. Each word is flashed on a computer screen either sandwiched between blank pictures or preceded and succeeded by images on the screen called distractors or masks [1], as illustrated in Fig. 1. Words in both scenarios are flashed for 30ms and the sequence of blank screens and words (or masks) is repeated, with a a fixed order, for a total of 5 minutes.
Figure 1.
Simplified sketch of the experiment [1]. The left illustration portrays the stream sequence used to cause the conscious-state perception, where the four lettered word is presented preceded and succeeded by blank screens. The right illustration portray the experiment where the word is sandwiched between distractors, or masks, which inhibits the conscious perception of the word and causes the subliminal-state activation. For each of these two experiments a control sequence is presented in which blank images are displayed instead of words.
In the first type of experiments a word is flashed on the computer screen sandwiched between blank images, designed to produce a conscious perception of the word by the subject, who, indeed, reports to have seen the word on the screen after each stream of images. We will refer to the fMRI signal of this state as conscious or unmasked (see Fig. 1). The second type of experiments are, on the contrary, designed to not produce any active perception of the word, which is in fact flashed sandwiched between scrambled words. The distractor images, indeed, act as ‘masks’ and the subject does not consciously detect the word on the screen. We will refer to the fMRI signal of this state as masked or subliminal (see Fig. 1).
For each of these two states a corresponding control sequence is presented in which the progression of the images on the screen remains the same for each case, but blank screens are displayed instead of words (see Fig. 1). These control conditions are used to estimate the background brain activity in order to better evaluate the activation of each brain voxel [1]. The fMRI signal was obtained for 15 subjects, and each of them repeated the experiment 5 times, thus data in [1] was collected for 75 different fMRI streams.
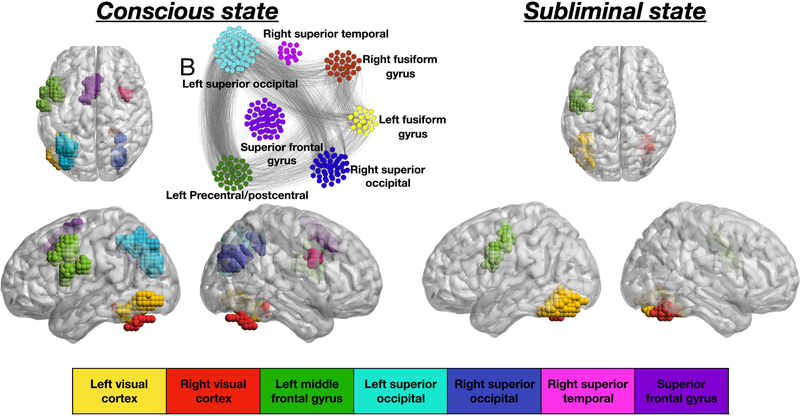
The acquired BOLD signal is processed using SPM99 [38]. The fMRI time series are then analyzed by using the widely adopted Generalized Linear model [33], which produces as output the activation map (AM). Fig. 2a shows the AM of the conscious state (p < 10−6), for a representative subject, whereas Fig. 2b illustrates the fMRI activation map of the subliminal state (p < 10−2) averaged across subjects (p-values in both cases are chosen accordingly to [1] and, for illustration, all the active nodes are shown with the same activation).Voxels are classified as belonging to a certain brain area with respect to their anatomical location and each brain area (module) is colored differently in the figures.
Figure 2.
Activation map and functional network of the conscious-state. a) Activation map of the conscious-state network for a representative subject (p < 10−6). Sagittal and axial view of the brain are shown. The visual cortex and the superior gyrus are involved in visual and word processing, the middle frontal and superior frontal gyrus respond to motor signaling while the superior temporal gyrus is involved in memory and information processing. b) Resulting functional network relative to the activation map of panel a) constructed with the procedure described in the Functional brain networks of the conscious state Subsection. c) Activation map of the subliminal-state network (p < 10−2), p-values are chosen accordingly to Ref. [1] in all panels.
By comparing the activation map of the conscious and subliminal state, shown respectively in Fig. 2a and Fig. 2c, we note that some brain regions are active in both brain states, i.e. the visual cortex (yellow and red module) and the left middle frontal gyrus (green module). These regions are, in addition, the only ones characterizing the activation of the subliminal state. The fMRI activation in each conscious experiment spreads further and involves additional clusters, for the case shown in Fig. 2a, for instance, it involves the left and right superior occipital gyrus (light blue and blue cluster respectively), right frontal gyrus (pink cluster) and sensory motor area (purple cluster).
Methods
This Section illustrates the procedure that we employ to investigate the transition from the conscious to the subliminal state, as described in the Introduction Section. From the fMRI activation map of the scans acquired during the conscious-state experiment we construct the functional brain network of this brain state, for each individual and for each single stream. Active fMRI voxels constitute the nodes of the network and links among these nodes are assigned by using pairwise correlations between the fMRI time series of the active voxels, with a procedure that we describe next (Fig. 2b shows one instance of this conscious network, corresponding to the fMRI activation of Fig. 2a).
Ideally, we would aim to build similar functional brain networks for the subliminal state, by employing the same procedure, so to have brain networks for the conscious- and subliminal-state experiment and then study the transition from one to the other. As discussed in the Data Section though, the subliminal state is characterized by a weaker overall fMRI activation, which therefore requires to apply a higher p-value threshold. As a consequence, noise effects play a greater role on the fMRI time series of the subliminal-state compared to the conscious-state time signals. Furthermore, the choice of a higher p-value produces subliminal AMs (obtained by comparing this state to the relative control stream) which present, in addition to clustered activity, isolated voxels spread across the brain that we consider false positives. In order to reduce these noise effects and get rid of this false positive activity, we averaged the activation maps of the subliminal state across streams and subjects, obtaining one final activation map for this statewhere the voxels are active if result in at least 80% of all activation maps. Furthermore, building a network for the subliminal state would not give any relevant information needed to explain the conscious → subliminal transition since the subliminal state is needed just to compare the reduction of the conscious network to validate any possible observation. Therefore, we limited in the use of the subliminal activation map as a benchmark for the study of the conscious → subliminal transition (Fig. 2c shows this final map) without constructing a subliminal-state functional network.
After we have built the functional brain networks for the conscious-state we trim each of these structures by performing inactivation (removal) of the nodes belonging to different k-cores, from low to high value of k. The purpose of thistrimming process it to identify the nodes which belong to each specific k-core and investigate whether, from this analysis, we can identify some pattern in the brain network structure of the conscious state, across subjects. We then investigate whether there exist marks which can help us identify the network differences between the conscious- and the subliminal-state as well as illuminate on the transition between these brain states. This procedure is described in details in Subsectionk-core percolation.
Functional brain networks of the conscious state
For each subject and each fMRI stream of the conscious-state experiment we construct the relative functional brain network, following the approach described in [5,18], for a total of 75 networks (15 subjects, 5 fMRI streams each). As mentioned, the nodes in each of these networks are the active voxels in the corresponding fMRI activation map. Links are assigned based on the thresholded pairwise correlations of the registered fMRI signal between node i and j, denoted as Cij, as we explain in more details in the following.
Brain networks show a modular organization [35], where different brain regions are specialized in the performance of different cognitive tasks. In order to depict this modular structure, we group the active voxels in brain clusters according to their anatomical location (see Fig. 2). This spatial organization suggests to distinguish between links that connect nodes within the same cluster, that we call in-links, and long range edges connecting nodes in different clusters, that we call out-links, as described in [18].
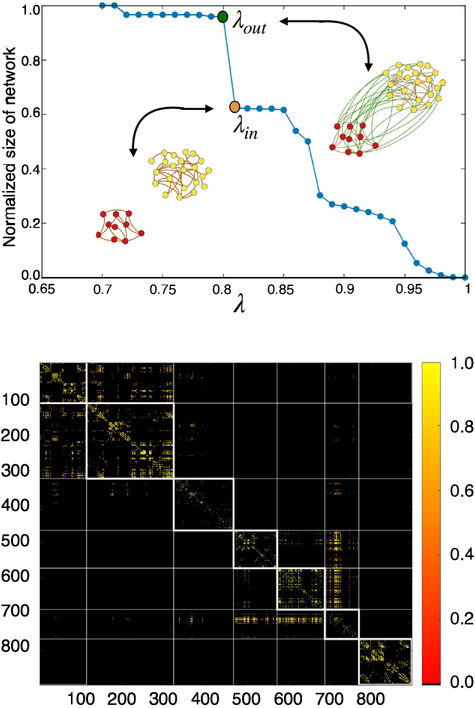
Following standard literature [5,18], we assign the links by thresholding the cross-correlation matrix in order to get rid of the weakest connections, such that two nodes i and j are wired together with the assigned weighted link Cij iff Cij ≥ λ, with λ a tunable threshold parameter. Accordingly, each threshold value defines a different functional network, identified by the thresholded correlation matrix that we denote as Cij(λ). The threshold parameter tunes the sparsity of this resulting network and therefore the size of its giant connected component (GCC). For λ = 1 the threshold is maximum and the nodes are isolated, so the GCC = 0. By decreasing λ, more and more nodes connect together and the GCC of the resulting network increases continuously till it reaches the unit value. Fig. 3a shows the behaviour of GCC vs λ for a representative subject.
Figure 3.
Functional network construction. Upper panel: Percolation plot, i.e. the GCC of a network defined by the adjacency matrix Cij(λ) vs the penalization parameter λ is shown. The orange dot in the plot indicate thevalue of λin used to fix the in-links within the two brain modules shown pictorially in the panel. The green dot pictures the value of λout employed to fix the out-links connecting the same two modules together. Lower panel: resulting adjacency matrix of the functional network obtained with the above procedure.
By following [18], we fix the λ parameter through a ‘percolation’ procedure described next. Each sharp discontinuity in Fig. 3a is due to the merging of connected brain clusters which abruptly increase the size of the GCC. At each one of these transitions we assign the in- and out-links of the brain clusters which connect together. An in-link between a node i and j within each of these clusters is assigned by Cij iff Cij ≥ λin, where λin is the value of λ right before the sharp transition at which the clusters merge occurs, coming from higher to lower λ values (see orange dot in Fig. 3a). An out-link between a node i and j belonging to different clusters is assigned by the thresholded correlation matrix Cij(λout), where λout is the value of λ right after the sharp transition (green dot in Fig. 3a). Fig. 3a illustrates this procedure and the resulting network pictorially, for a representative subject. The adjacency matrix of the final architecture is shown in Fig. 3b, where nodes are ordered sequentially according to their cluster association, in order to show the brain network’s modular structure.
We note that other methods [22,3] could be used to build the functional networks. Our choice on the use of the percolation procedure to build such architecture was driven by the constraint that brain networks are sparse and such procedure guarantees sparsity by not overestimating the number of links between different clusters. We stress that the wiring only reflects functional relations among fMRI active voxels and, in general, differs from the structural wiring obtained, for instance, through diffusion tensor imaging or other method of physical connectivity [23,16]. Thus, all our analysis and results must be considered as grounded on the functional network framework.
k-core percolation
The concept of k-core has been firstly introduced in social sciences [32] to describe network cohesion and, since then, it has been applied in many contexts, to describe robustness of random networks [17], viral spreading in social networks [24] and large-scale structure of the brain [21].
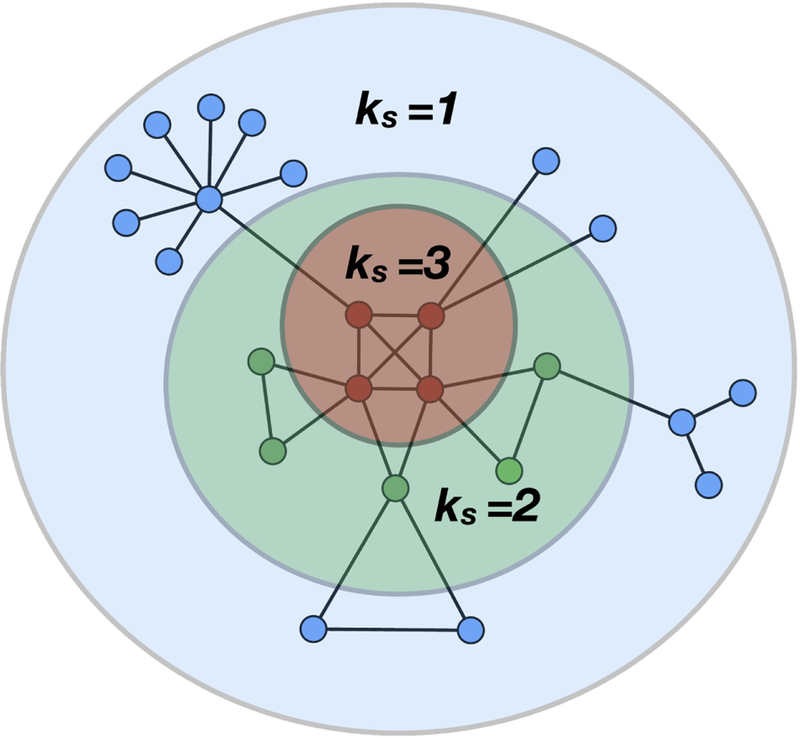
For a given architecture, the k-core is the maximal subgraph, not necessarily globally connected, which consists of all the nodes with at least k neighbours. This subnetwork can be obtained by removing iteratively all the nodes which have less than k connections. Thus, to extract the k-core one starts pruning all the nodes with degree less than k. The removal of these nodes reduces the degree of their neighbors that can then drop below k. Thus, these nodes should be removed in turn, and the procedure iterates until no more nodes can be removed. The remaining structure is the k-core of the network (see Fig. 3).
For a given k, the k-core includes cores with higher k, thus the 1-core includes the 2-core, the 2-core includes the 3-core and so forth. Each k-core consists of the nodes in the periphery which is called k-shell (labelled ks) and the resting k + 1-core. The k-shell is, therefore, the region of the k-core which is not included in the k + 1-core (see Fig. 3). Therefore the network has a nested structure made of k-core subnetworks with increasing k and k-shells of order ks. The innermost core of the network corresponds to the structure with the maximum k-core, called , which is a topological invariant of the network [17].
For each one of the 75 conscious-state network, we can then compute the k-core and k-shell occupancy, i.e. the density of nodes which occupy each k-core or k-shell with a given k. An interesting property of these networks emerges when one examines the nodes and the nodes’ brain anatomical area in each k-shell. We discuss the results of this analysis in the next session.
Results
The maximal k-core of the conscious network corresponds to the subliminal-state
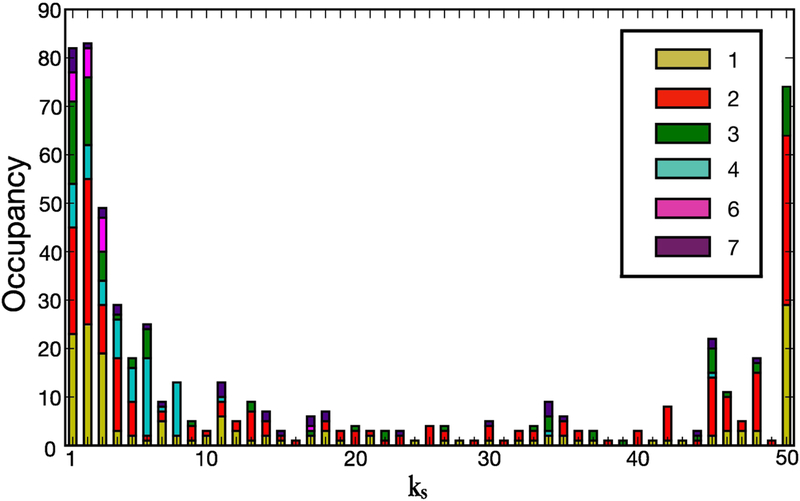
Once we have performed the k-core trimming process as described in the previous Section, we can calculate the occupancy of each k-shell, for each subject, that is, the number of nodes in each k-shell. Fig. 5 illustrates this occupancy for a representative conscious-state network. We note that, interestingly, the distribution presents a U-shape: it shows very high occupancy values for both very small and very high k-shell values, and low occupancy for the intermediate k-shell values. This shape of the distribution is consistent throughout all the conscious networks analyzed. Reference [7] attributes the U-shape of the occupancy distribution to the stability of the system: the high population of nodes in the lowest and highest k-shells suggests network robustness against both random local and global attacks, thus making the brain a resiliant system under these kind of perturbations. The same feature is also observed in ecosystems and financial networks [7] and it is general feature of many networks called the core-periphery structure [9,25,4,44,41].
Figure 5.
k-shell occupancy for the conscious network of a representative subject. The distribution presents a U-shape: high population of nodes in the lowest and highest k-shells. We observe that the shells with the lowest k are inhabited by nodes which belong to all the 7 brain clusters which are fMRI active in the brain, for this subject. On the contrary, the maximum k-shell, the inner core of the network, is made by nodes which belong to only 3 clusters which, more importantly, are the only fMRI active clusters of the subliminal-state.
We further observe that for the subject shown in from Fig. 5 the k-shells with small k’s are populated by nodes that belong to any fMRI active module and, therefore, nodes that are spread across all the active brain regions. More interestingly, Fig. 5 emphasizes that the nodes which inhabit the k-shells with the highest k (k = 50 for this subject) belong exclusively to those brain modules that are the only active in the subliminal-state, namely the right and left visual cortex and the left precentral gyrus (see Fig. 2c).
Figure 6 shows pictorially the k-core decomposition process for the same subject presented in Fig. 5. Figure 6a illustrates the progressive inactivation of the fMRI active voxels, based on their k-corein the conscious-state network, while Fig. 6b shows the occupancy number in each of these k-cores, i.e. the number of nodes in each k-core. Figure 6c shows the k-core decomposition process by highlighting the network connectivity. As discussed for Fig. 5, Fig. 6c shows that the for this particular conscious-state network is made by the visual cortex (yellow and red cluster) and by the precentral gyrus (green cluster), which are the only fMRI active clusters in the averaged subliminal-state activation map.
Figure 6.
k-core decomposition illustrated both in the activation brain map and in the functional network. a) Effect of the k-core trimming process on the activation map of the conscious-state, for increasing k-values. Nodes located in the low k-cores belong to all the brain clusters, on the contrary, nodes in the belong to the visual cortex and middle frontal gyrus (green, red and yellow modules). b) Number of nodes in each k-core c) Same k-core decomposition of panel a), with a different visualization made on the functional network. Same considerations on the apply.
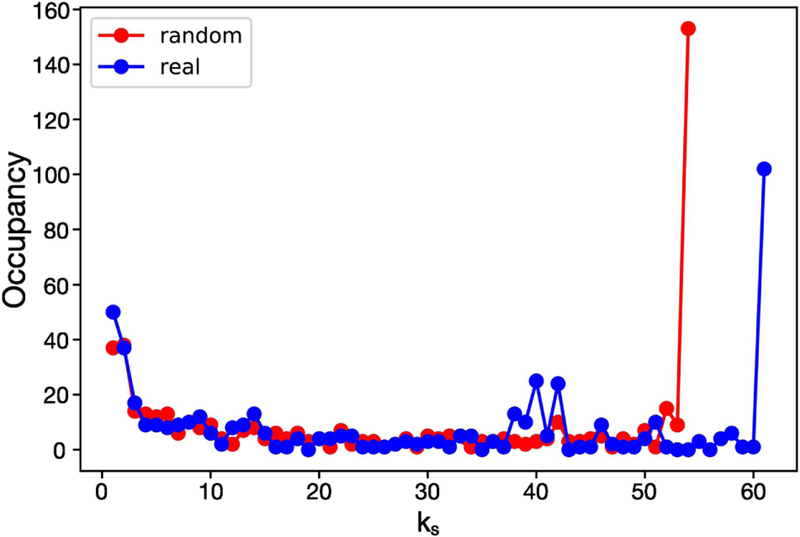
To verify whether these results are due to non-random effects we performed the following analysis. For each of the 75 conscious-state graphs we generated 106 new architectures obtained by randomly rewiring the original network and keeping constant the degree of each node. We then apply k-core decomposition to each of these 106 random networks and compute the k-shell occupancy. This obtained occupancy is then averaged across the generated random networks and compared with the k-shell occupancy of the conscious-state network from which the random architectures are created. Results are shown in Fig. 7 for a representative subject and illustrate two interesting points. First, the functional conscious-state network has a much higher than the averaged random case. Second, the averaged occupancy distribution of the random networks shows the same U-shape feature that we found in all the functional conscious-state networks obtained from the fMRI signal. This suggests that the source of this shape is related to the degree distribution of the nodes, being this distribution the same both in the real conscious-state and randomly generated networks. We mention that although Fig. 7 refers to a representative case, we found qualitatively the same results for all the 75 conscious-state networks.
Figure 7.
k-shell occupancy distribution. Comparison between real conscious-state and a random networks generated as described in the Results Section is shown. Random networks exhibit a much lower value of the maximum k-shells compared to the real network, a behavior common to all the conscious-state networks (p < 10−6).
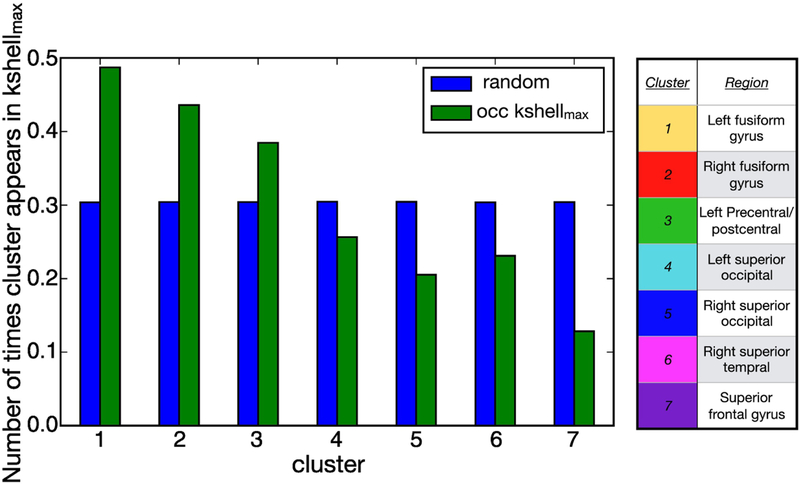
As already noted, the results of Fig. 6 illustrate that, for this representative subject, the nodes which populate the of the conscious-state network belong to clusters which are the only active ones in the averaged subliminal-state activation map (see Fig. 2c). In order to check whether this result is consistent across all the conscious-state networks we performed a group analysis at the clusters level. For each of the 75 conscious networks we assign count 1 to the cluster of nodes belonging to the . For instance, for the particular network of Fig. 5 we assign count 1 to clusters 1, 2 and 3 (yellow, red and green respectively, which populate the ). The normalized occupation number of the clusters in the across conscious-state networks is shown in Fig. 8, where the clusters havebeen ordered progressively. The green histogram represents the frequency with which each cluster appears in the , independent of the amount of nodes that populate the maximum k-shell. These results are compared to random ones illustrated by the blue histogram. The probability that each cluster is, at random, in the is 1/7 of the sum of counts of all modules which, when normalized with respect to the numberof conscious networks analyzed (75 networks), translates to a 30% chance to populate the (see Fig. 8).
Figure 8.
Cluster occupancy of the nodes in the maximum k-shell. Green bars show the normalized cluster occupancy of the nodes which populate the maximum k-shell. If the occupation of the k-shell were a random effectthen one would find a distribution of at least 30% in each cluster (blue bars). We observe that the left and right fusiform gyrus and the left prefrontal gyrus populate the maximum k-shell more than at random.
This comparison not only shows that the visual cortex and precentral gyrus (cluster 1, 2 and 3 in Fig. 8) are those which mostly populate the of the conscious-state network across subjects, it also points out that this is not due to random effect. As reported above, these clusters are the only active ones in the subliminal-state experiment. The other four clusters (3 to 7 in Fig. 8) populate the with a normalized frequency which is less than a random effect, making their presence in the maximum k-core statistically less significant.
As a further test, we check whether the above group results at the cluster level are also consistent at the node level. In other words, we want to investigate whether, across networks, the nodes in the of theconscious-state are the same nodes which are active in the subliminal-state. For each conscious-state network we compute how many nodes (nk) are in the , and we check how many of these nodes are also in the activation map of the subliminal-state, we refer to this number as nx. Then, in each conscious-state network we randomly select nk nodes and check how many of them also belong to the activation map of the subliminal-state. We repeat this random sampling 105 times in order to have a distribution of randomly selected nodes in the conscious network which are also in the subliminal activation map and perform a t-test with the overlap nx described above. In Fig. fconc we show the results for the networks which passed the t-test. In details, the left panels show nodes which are both part of the of the conscious-state and of the AM of the subliminal-state (show in the right panels for comparison), consistently across networks. Quantitatively, nearly 1/3 of the nodes in the AM of the subliminal-state also belong to the of all the conscious functional networks that pass the t-test (precisely, 112 nodes over 340). This suggest that the subliminal-state, which remains active during period of non-conscious perception, constitutes a large part of the of the conscious state.
Discussion
In this Section we elaborate on the interpretation of the results by introducing a dynamical model describing the time evolution of mutualistic complex systems [29] which directly addressed the stability of the network and its relation to the k-core. The model of [29] only applies to the complex networks with only positive interaction. Since the correlations between the nodes of the conscious-state networks turn out to be positive, the dynamics of these brain networks can be modeled with differential equations accounting for mutualistic interplay proposed in Ref. [29]. Recent results [29] show that, for such mutualistic systems, the of the network is the most resilient structure, i.e. the last architecture which collapses, to the weakening of the interactions strength. The results discussed in the Results Section show that the of the conscious-state largely overlap with the subliminal-state activation map. Thus, in short, the findings of [29] help us interpreting the subliminal-state as the most resilient part of the conscious-state when the correlations (interactions) strength is weakened. This leads us to theorize that the conscious → subliminal transition in the brain happens through the weakening of the interactions strength in the network. In other words, regions which are highly correlated in the conscious-state suddenly become less correlated and, therefore, not fMRI active thus producing a subliminal state of activation. We see this effect in the data through the activation map shown in Fig. 2 which shows that, indeed, the subliminal state is characterized by much less fMRI activation (compare Fig. 2a with Fig. 2c). Furthermore, the results discussed in the Results Section demonstrate that the residual activation of the subliminal-state largely matches with the of the functional conscious-state network. These two evidences are consistent with the results discussed in [29] which help us interpreting the transition conscious → subliminal as taking place trough the activity collapse of certain conscious-state area, due to decrease covariation among these areas, leaving residually active only areas in the . These areas are therefore the most resilient ones, as shown in [29], and, in our case, those which characterize the subliminal brain activity. In the next Section we briefly review the relevant results of Ref. [29] to the above discussion in order to elaborate an interpretation of our results and a description of the conscious → subliminal transition at the functional networklevel.
Dynamical model and k-core percolation
The dynamics of a neural network can be described by a model of coupled interacting neurons through sigmoidal responses [34,2,19]. Here, by coarse graining the neural activity, we use the same model to describe the dynamical evolution of the fMRI signal in each voxel, with the following nonlinear differential equations [34,2]
| (1) |
Above, xi(t) is the fMRI activity of voxel i, I is the background BOLD activity, R is the inverse of the inactivation rate, n is the slope of the sigmoid function, α is a BOLD activity threshold at the fMRI voxel level, Aij is the adjacency matrix, i.e. Aij = 1 if voxel i and j are connected and zero otherwise and Jij is the interaction strength between pair of voxels where we take Jij = Cij as the strength of correlations from the data. Notice that the theory is only valide in the absence of inhibition, i.e Jij > 0. Let us note that the matrix shown in Fig. 3b includes both the information encoded in Aij (whether a link is present or not) and in Jij (the strength of such link). In (Eq. 1) we employ this slightly different formalism for consistency with Ref. [29].
For a given set of initial conditions, the fixed point solution of Eq. (1) is completely determined by the values of the dynamical parameters. Of particular interest is the identification of the tipping point by tuning of these parameters, i.e. the point at which xi = 0 for each i. In general, the analytical derivation of the fixed point solution of Eq. (1) is too cumbersome. Morone et al. in [29] have shown, yet, that under the assumptions of constant couplings (Jij = J for all i, j) and by replacing , where Θ(x) is the Heaviside function, it is possible to obtain an approximate solution of this tipping point.
We observe that, in the data of the experiments [1], analyzed and discussed in the previous Sections, the interactions among voxels are mainly positive (see Fig. 3b). This outcome could be explained by noting that the fMRI signal is stimulus-driven (words shown on a screen) and, therefore, the Pearson correlation coefficient among the fMRI activity of two voxels which follow the same stimulus is most likely positive. If we then assume that these interactions (correlations) have all the same strength J, by following the approximation of [29] for the sigmoidal function, we can rewrite (Eq. 1) as
| (2) |
and, with the following change of variable
| (3) |
Eq. (2) can be written in terms of the reduced density y*, in the following form:
| (4) |
with
| (5) |
The parameter KJ in Eq. (4) controls the threshold of mutualistic benefit [29] which, in the case of study, is a threshold of mutualistic signal enhancement between voxels. In practice, KJ is the threshold in the Θ-function of Eq. (4) which allows voxel i to increase its activation thanks to the interaction with voxel j only when the densities y* are greater than KJ. Let us observe that KJ is inversely proportional to the interaction strength J. By weakening the interactions the threshold increases and, thus, the final activity of voxel i decreases. In other words, by keep decreasing the interactions, the activity of some of the voxels yj falls under threshold and therefore confers no activation to yi (see Eq. (4)). Hence, from Eqs. (4) and (5) it is clear that there exist a critical value Jc, and thus a critical threshold KJ(Jc), at which the only solution of Eq. (4) is y*= 0.
In Ref. [29] the authors show that this critical threshold is related to the maximum k-core of the network. Indeed, the reduced density assumes only integer values in the set , where ki is the degree of voxel i. For a given threshold KJ, the voxels with degree kj < KJ do not contribute to Eq. (4), so they can be removed from the network. After this removal, some of the remaining voxels will have a smaller degree kj′ (due to the fact that they have lost some of their neighbours with the removal). The voxels with kj′ < KJ can then be removed in turn, because they will not contribute to Eq. (4), and so forth. This process is exactly the algorithm for extracting the KJ-core from a network and the voxels remaining at the end of this procedure are the voxels belonging to the KJ-core [29]. By increasing the threshold KJ from low to higher values, voxels from the low-to-higher k-cores will cease to contribute to the dynamics of the network, until the critical threshold is reached. Above this threshold, the only fixed point solution is y* = 0.
From this findings it results that, as also mentioned at the beginning of the Discussion Section, the structure is the most resilient part of a network to the decreasing of the interactions strength. Based onthese findings, we interpret the conscious → subliminal transition as a passage from high to lower correlations among brain areas which ends in a final state, i.e. the subliminal, that corresponds to the of the conscious-state network. It is worth mentioning that this dynamical model could be applied to any experiment on consciousness that results in positive interactions between active nodes assuming that the underlying dynamics is the one described Eq. (1).
Our results in the light of the consciousness theories of Libet and Dehaene
Two prominent theories of the relation between unconscious information and conscious access have been developed by Benjamin Libet and Stanislas Dehaene. The former stressed how, through the analysis of EEG data, all external stimuli is processed in the brain unconsciously a couple of hundred of milliseconds before any voluntary act. According to this theory, unconscious information is the spark for the initiation of all conscious actions, and there is a role for consciousness and executive control to regulate actions of information processed subliminally [28]. On the other hand, Stanislas Dehaene, has shown the existence of a large-scale versatile brain system that involves regions in the parietal and frontal cortex that set a temporary workspace to bind and share information [13,12,40]. This framework which allows exchange of information through first bottom up, followed by top down propagation, is referred to as ignition; if the incoming stimuli does not activate voxels strongly enough, then the information will not be manifested consciously by the brain.
Our findings add a new view which is consistent with these theories. Both share the notion that, while conscious activation involves the non-lineal and massive activation of a broad set of brain areas in an ignition process, the onset of this process is in local-circuits which encode information for this specific process which might become conscious. Our work shows that despite the massive propagation and of activity, this core of activity which was at the seed of the unconscious activity remains at the deepest core at the shell structure of the functional networks. This finding is quite reminiscent of the theory of vision proposed by David Mumford and colleagues [27]. The theory argues that V1 is a high frequency functional core of the brain. It buffers and holds temporarily (as in a blackboard, or as in a workspace) information for which it is receptive fields are optimally suited. In other words, a core shell of conscious activation, may not be a common set of neurons, but instead vary according to the functional requirements of the specific conscious percept at any given time. Two prominent theories of the relation between unconscious information and conscious access have been developed by Benjamin Libet and Stanislas Dehaene. The former stressed how, through the analysis of EEG data, all external stimuli is processed in the brain unconsciously a couple of hundred of milliseconds before any voluntary act. According to this theory, unconscious information is the spark for the initiation of all conscious actions, and there is a role for consciousness and executive control to regulate actions of information processed subliminally [28]. On the other hand, Stanislas Dehaene, has shown the existence of a large-scale versatile brain system that involves regions in the parietal and frontal cortex that set a temporary workspace to bind and share information [13]. This framework which allows exchange of information through first bottom up, followed by top down propagation, is referred to as ignition; if the incoming stimuli does not activate voxels strongly enough, then the information will not be manifested consciously by the brain.
Conclusions
In this work we investigated the conscious → subliminal transition in the brain through the network analysis of fMRI data collected in Ref. [1] where two experiments on human subjects were performed, specifically designed to induce either a conscious or a non-conscious (subliminal) perception of a word flashed on a screen.
From the data we first observed that the fMRI activation of the subliminal-state is largely a subset of the activation of the conscious-state. Furthermore, we note that the links in the functional brain network of the conscious-state, built from the fMRI signal, are mostly positive.
These two observations from the data analysis, together with the recent findings of Ref. [29], led us to perform a k-core study of the conscious-state network structure. The authors of [29] recognized indeed that, under certain approximations, neural dynamical systems with positive interactions show a decrease of their activation to the weakening of their interactions strength. The most resilient part of the network to this kind of weakening, i.e. the last structure to remainactive, is the of the system. So, driven by the above observations we investigated whether the subliminal-state was related to the of the conscious-state.
We found that, at the cluster level, the subliminal-state is made of fMRI active clusters which are those that most populate the of the conscious-state network, across subjects and experiments. At the node level, we found that roughly 1/3 of the active voxels of the subliminal-state exactly overlap (node by node) with the nodes in the of the conscious-state network, across fMRI streams. To verify that these results were not due to chance, we also compared them with outcomes obtained from suitable randomly generated models.
Overall, these findings are in agreement with the prediction of Ref. [29] and led us to conclude that the conscious → subliminal transition may be interpreted as caused by a decrease of the correlated fMRI activity among voxels, due tothe fMRI inhibition of certain brain areas. The areas which survive this inhibition, i.e. those which constitute the subliminal-state, are also those that, statistically, belong to the most resilient structure of the conscious-state network: the . This not only sheds light on the nature of the conscious → subliminal transition but, furthermore, motivates us to interpret the subliminal-state activity as the most robust to the weakening of the fMRI signal. Indeed, this state is the one which persists as background fMRI activity when non-conscious perception is present and the state from which conscious perception arises.
The conscious → subliminal transition is a profound and intriguing problem in neuroscience and this work certainly does not answer all the questions that it rises. On the other hand, from a system neuroscience perspective, we think our resultshighlight the importance of studying network structures that could unveil useful patterns or markers able to shed light on similarity and differences between conscious and subliminal awareness and on the transition from one to the other.
Figure 4.
Cartoon of a 3-core network k-shells are defined as the set of nodes that belong to the k-core but not the k + 1-core. As illustrated, k-shells are concentric; low k-shells are located in the outer part of the network, while for increasing k, nodes are situated in the most focal part until one reaches the highest k-shell, which corresponds to the k-core, and is located at the center of the graph
Figure 9.
Statistical analysis at the node level. Left panels: nodes which are in the of all conscious-state networks that pass the t-test (p < 10−5) when compared with the subliminal-state. Right panel: activation map of the subliminal-state shown for comparison. Roughly 1/3 of the nodes which belong to the of the conscious-state also belong to the subliminal-state activation map.
Highlights.
The maximal k-core of the conscious network corresponds to the subliminal-state.
Occupancy of the nodes in the conscious-state as a function of k-shells have a U-shape distribution.
Transition from conscious to subliminal state obtained in priming experiments can be modeled through k-core percolation.
1/3 of the nodes in the maximum k-core of the conscious network also belong to the subliminal state.
Acknowledgements.
We thank Flaviano Morone and Lucas Parra for useful discussions and insights. We thank Stanislas Dehaene for graciously sharing his data from Ref. [1] and allowing us to analyze this dataset. This work is supported by NIH-NIGMS R01EB022720, NIH-NCI U54CA137788/U54CA132378 and NSF-IIS 1515022.
Footnotes
Publisher's Disclaimer: This is a PDF file of an unedited manuscript that has been accepted for publication. As a service to our customers we are providing this early version of the manuscript. The manuscript will undergo copyediting, typesetting, and review of the resulting proof before it is published in its final citable form. Please note that during the production process errors may be discovered which could affect the content, and all legal disclaimers that apply to the journal pertain.
References
- [1].Alvarez-Hamelin JI, Dall’Asta L, Barrat A, & Vespignani A. 2008. K-core decomposition of Internet graphs: hierarchies, self-similarity and measurement biases. Networks and Heterogeneous Media, 3, 371–393. [Google Scholar]
- [2].Amit DJ. 1989. Modeling brain function: The World of Attractor Neural Networks. Cambridge University Press. [Google Scholar]
- [3].Anzellotti S, & Coutanche MN. 2018. Beyond functional connectivity: Investigating networks of multivariate representations. Trends in Cognitive Sciences, 22, 258–269. [DOI] [PubMed] [Google Scholar]
- [4].Borgatti SP, & Everett MG. 2000. Models of core/periphery structures. Social Networks, 21, 375–395. [Google Scholar]
- [5].Bullmore E, & Sporns O 2009. Complex brain networks: graph theoretical analysis of structural and functional systems. Nature Reviews Neuroscience, 10, 186. [DOI] [PubMed] [Google Scholar]
- [6].Bullmore E, & Sporns O 2012. The economy of brain network organization. Nature Reviews Neuroscience, 13, 336. [DOI] [PubMed] [Google Scholar]
- [7].Burlesson-Lesser K, Morone F, & Makse HA. 2018. K-core robustness in ecological and financial networks. submitted. [DOI] [PMC free article] [PubMed]
- [8].Carmi S, Havlin S, Kirkpatrick S, Shavitt Y, & Shir E 2007. A model of Internet topology using k-shell decomposition. Proceedings of the National Academy of Sciences, 104, 11150–11154. [DOI] [PMC free article] [PubMed] [Google Scholar]
- [9].Corradino C 1990. Proximity structure in a captive colony of Japanese monkeys (Macaca fuscata fuscata): An application of multidimensional scaling. Primates, 31, 351–362. [Google Scholar]
- [10].Craddock RC, Jbabdi S, Yan CG, Vogelstein JT, Castellanos FX, Di Martino Ad, Kelly C, Heberlein K, Colcombe S, & Milham MP. 2013. Imaging human connectomes at the macroscale. Nature Methods, 10, 524. [DOI] [PMC free article] [PubMed] [Google Scholar]
- [11].Deco G, McIntosh AR, Shen K, Hutchison RM, Menon RS, Everling S, Hagmann P, & Jirsa VK. 2014. Identification of optimal structural connectivity using functional connectivity and neural modeling. Journal of Neuroscience, 34, 7910–7916. [DOI] [PMC free article] [PubMed] [Google Scholar]
- [12].Dehaene S 2014. Consciousness and the brain: Deciphering how the brain codes our thoughts. Penguin. [Google Scholar]
- [13].Dehaene S, & Naccache L 2001. Towards a cognitive neuroscience of consciousness: basic evidence and a workspace framework. Cognition, 79, 1–37. [DOI] [PubMed] [Google Scholar]
- [14].Dehaene S, Naccache L, Cohen L, Le Bihan D, Mangin JF, Poline JB, & Rivière D 2001. Cerebral mechanisms of word masking and unconscious repetition priming. Nature Neuroscience, 4, 752. [DOI] [PubMed] [Google Scholar]
- [15].Del Ferraro G, Moreno A, Min B, Morone F, Pérez-Ramírez Ú, Pérez-Cervera L, Parra LC, Holodny A, Canals S, & Makse HA. 2018a. Finding influential nodes for integration in brain networks using optimal percolation theory. Nature Communications, 9, 2274. [DOI] [PMC free article] [PubMed] [Google Scholar]
- [16].Del Ferraro G, Moreno A, Min B, Morone F, Pérez-Ramírez U, Pérez-Cervera L, Parra LC, Holodny A, Canals S, & Makse HA,. 2018b. Finding influential nodes for integration in brain networks using optimal percolation theory. Nature Communications, 9, 2274. [DOI] [PMC free article] [PubMed] [Google Scholar]
- [17].Dorogovtsev SN, Goltsev AV, Mendes JFF. 2006. K-core organization of complex networks. Physical Review Letters, 96, 040601. [DOI] [PubMed] [Google Scholar]
- [18].Gallos LK, Makse HA, & Sigman M. 2012. A small world of weak ties provides optimal global integration of self-similar modules in functional brain networks. Proceedings of the National Academy of Sciences, 109, 2825–2830. [DOI] [PMC free article] [PubMed] [Google Scholar]
- [19].Gao J, Barzel B, & Barabási A 2016. Universal resilience patterns in complex networks. Nature, 530, 307. [DOI] [PubMed] [Google Scholar]
- [20].Greicius MD, Krasnow B, Reiss AL, & Menon V. 2003. Functional connectivity in the resting brain: a network analysis of the default mode hypothesis. Proceedings of the National Academy of Sciences, 100, 253–258. [DOI] [PMC free article] [PubMed] [Google Scholar]
- [21].Hagmann P, Cammoun L, Gigandet X, Meuli R, Honey CJ, Wedeen VJ, & Sporns O. 2008. Mapping the structural core of human cerebral cortex. PLoS Biology, 6, e159. [DOI] [PMC free article] [PubMed] [Google Scholar]
- [22].Hermundstad AM, Bassett DS, Brown KS, Aminoff EM, Clewett D, Freeman S, Frithsen A, Johnson A, Tipper CM, Miller MB, et al. 2013. Structural foundations of resting-state and task-based functional connectivity in the human brain. Proceedings of the National Academy of Sciences, 110, 6169–6174. [DOI] [PMC free article] [PubMed] [Google Scholar]
- [23].Honey CJ, Sporns O, Cammoun L, Gigandet X, Thiran JP, Meuli R, & Hagmann P 2009. Predicting human resting-state functional connectivity from structural connectivity. Proceedings of the National Academy of Sciences, 106, 2035–2040. [DOI] [PMC free article] [PubMed] [Google Scholar]
- [24].Kitsak M, Gallos LK, Havlin S, Liljeros F, Muchnik L, Stanley HE, & Makse HA. 2010. Identification of influential spreaders in complex networks. Nature Physics, 6, 888. [Google Scholar]
- [25].Krugman PR. 1996. The self-organizing economy. Blackwell Oxford. [Google Scholar]
- [26].Lahav N, Ksherim B, Ben-Simon, Etand Maron-Katz A, Cohen R, & Havlin S. 2016. K-shell decomposition reveals hierarchical cortical organization of the human brain. New Journal of Physics, 18, 083013. [Google Scholar]
- [27].Lee TS. 1998. Mumford D, Romero R, and Lamme VA. The role of the primary visual cortex in higher level vision. Vision Res, 38. [DOI] [PubMed] [Google Scholar]
- [28].Libet B 1985. Unconscious cerebral initiative and the role of conscious will in voluntary action. Behavioral and Brain Sciences, 8, 529–539. [Google Scholar]
- [29].Morone F, Del Ferraro G, & Makse HA. 2019. The k-core as a predictor of structural collapse in mutualistic ecosystems. Nature Physics, 15, 95–102. [Google Scholar]
- [30].Pittel B, Spencer J, & Wormald N 1996. Sudden Emergence of a Giantk-Core in a Random Graph. Journal of Combinatorial Theory, Series B, 67, 111–151. [Google Scholar]
- [31].Rubinov M, & Sporns O 2010. Complex network measures of brain connectivity: uses and interpretations. Neuroimage, 52, 1059–1069. [DOI] [PubMed] [Google Scholar]
- [32].Seidman SB. 1983. Network structure and minimum degree. Social Networks, 5, 269–287. [Google Scholar]
- [33].Smith SM, Jenkinson M, Woolrich MW, Beckmann CF, Behrens TEJ, Johansen-Berg H, Bannister PR, De Luca M, Drobnjak I, Flitney DE, et al. 2004. Advances in functional and structural MR image analysis and implementation as FSL. Neuroimage, 23, S208–S219. [DOI] [PubMed] [Google Scholar]
- [34].Sompolinsky H, Crisanti A, & Sommers HJ. 1988. Chaos in Random Neural Networks. Physical Review Letters, 61(Jul), 259–262. [DOI] [PubMed] [Google Scholar]
- [35].Sporns O 2013. Structure and function of complex brain networks. Dialogues in Clinical Neuroscience, 15, 247. [DOI] [PMC free article] [PubMed] [Google Scholar]
- [36].Sporns O, Tononi G, & Kötter R 2005. The human connectome: a structural description of the human brain. PLoS Computational Biology, 1, e42. [DOI] [PMC free article] [PubMed] [Google Scholar]
- [37].Tononi G, Boly M, Massimini M, & Koch C 2016. Integrated information theory: from consciousness to its physical substrate. Nature Reviews Neuroscience, 17, 450. [DOI] [PubMed] [Google Scholar]
- [38].UCL. 1999. http://www.fil.ion.ucl.ac.uk/spm.
- [39].Van Den Heuvel MP, & Pol HEH. 2010. Exploring the brain network: a review on resting-state fMRI functional connectivity. European Neuropsychopharmacology, 20, 519–534. [DOI] [PubMed] [Google Scholar]
- [40].Van Vugt B, Dagnino B, Vartak D, Safaai H, Panzeri S, Dehaene S, & Roelfsema PR. 2018. The threshold for conscious report: Signal loss and response bias in visual and frontal cortex. Science, 360, 537–542. [DOI] [PubMed] [Google Scholar]
- [41].Verma T, Russmann F, Araújo NAM, Nagler J, & Herrmann HJ. 2016. Emergence of core–peripheries in networks. Nature Communications, 7, 10441. [DOI] [PMC free article] [PubMed] [Google Scholar]
- [42].Watts DJ, & Strogatz SH. 1998. Collective dynamics of small-world networks. Nature, 393, 440–442. [DOI] [PubMed] [Google Scholar]
- [43].Yan G, Vértes PE, Towlson EK, Chew YL, Walker DS, Schafer WR, & Barabási A. 2017. Network control principles predict neuron function in the Caenorhabditis elegans connectome. Nature, 550, 519. [DOI] [PMC free article] [PubMed] [Google Scholar]
- [44].Zhang X, Martin T, & Newman MEJ. 2015. Identification of core-periphery structure in networks. Physical Review E, 91, 032803. [DOI] [PubMed] [Google Scholar]


