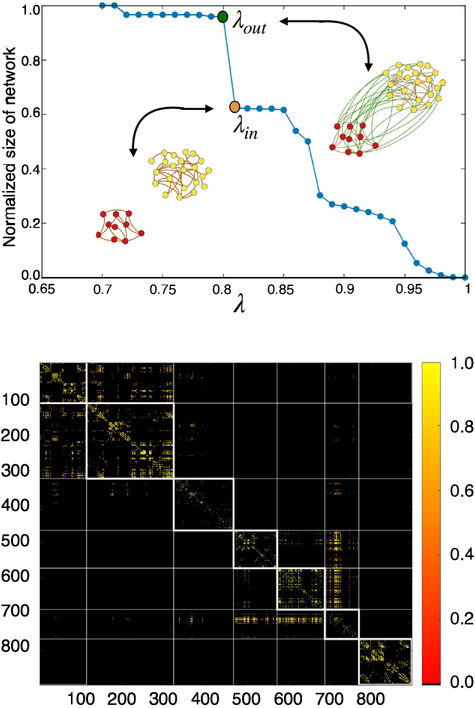
Figure 3.
Functional network construction. Upper panel: Percolation plot, i.e. the GCC of a network defined by the adjacency matrix Cij(λ) vs the penalization parameter λ is shown. The orange dot in the plot indicate thevalue of λin used to fix the in-links within the two brain modules shown pictorially in the panel. The green dot pictures the value of λout employed to fix the out-links connecting the same two modules together. Lower panel: resulting adjacency matrix of the functional network obtained with the above procedure.

