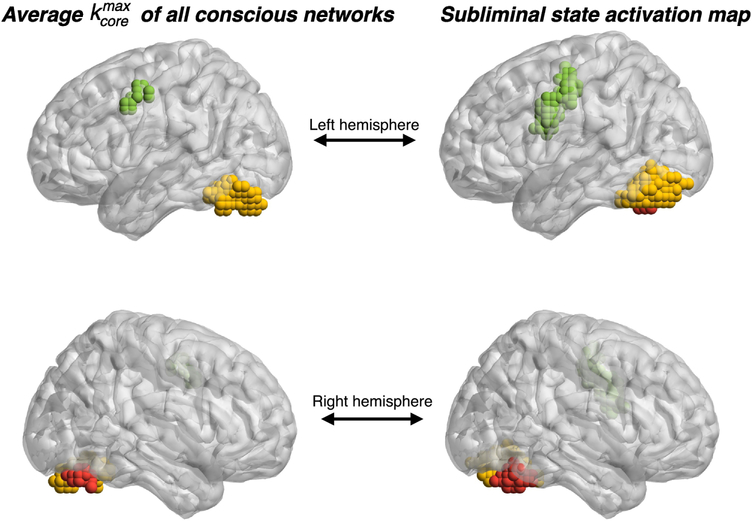
Figure 9.
Statistical analysis at the node level. Left panels: nodes which are in the of all conscious-state networks that pass the t-test (p < 10−5) when compared with the subliminal-state. Right panel: activation map of the subliminal-state shown for comparison. Roughly 1/3 of the nodes which belong to the of the conscious-state also belong to the subliminal-state activation map.

