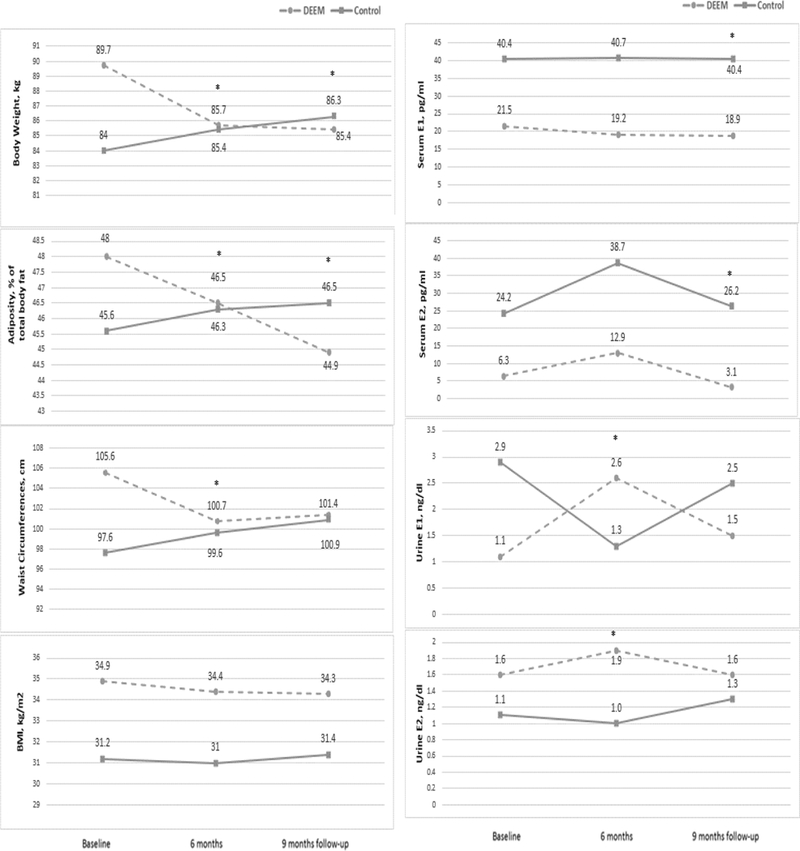
Figure 3. Changes in body composition and serum and urine estrogens in the intervention and control groups.

E1 = estrone; E2 = estradiol; * indicates statistically significant differences in changes of each outcome variable between the intervention and control groups (p < 0.05).
