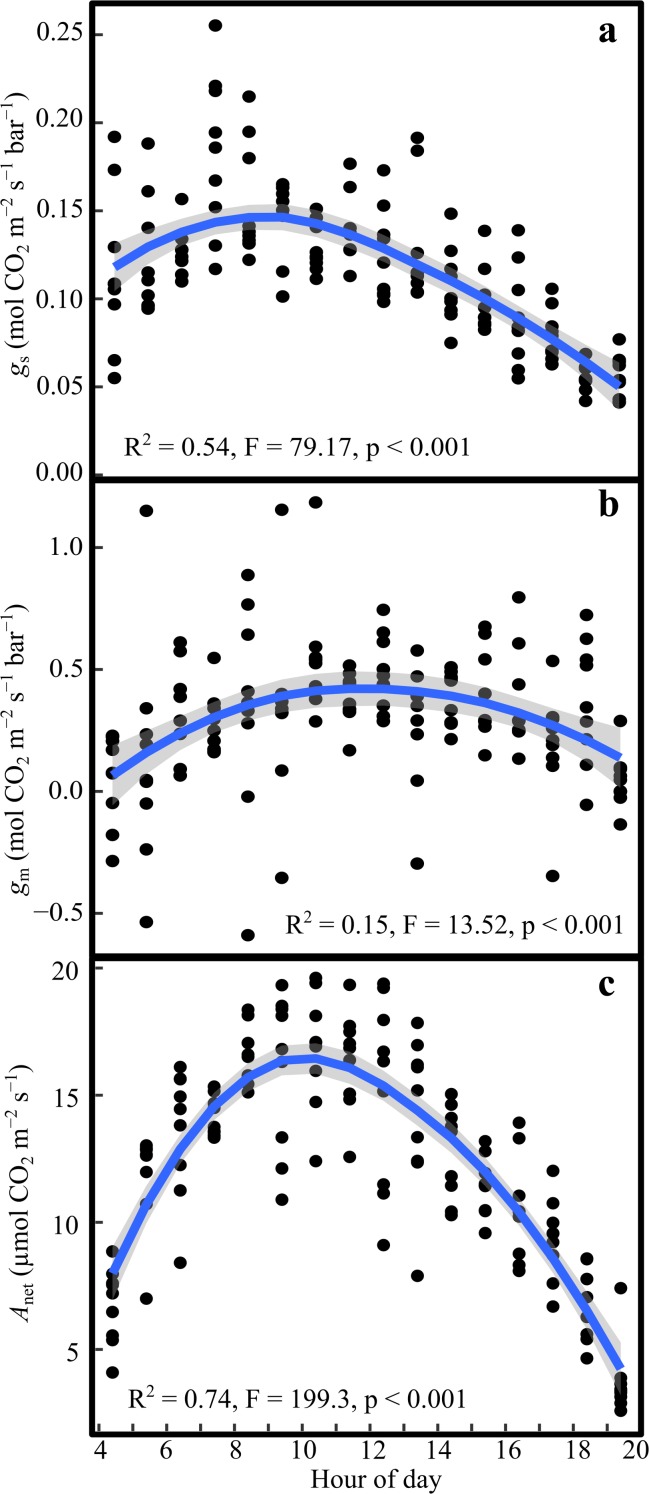
Fig. 2.
Diurnal variation in a stomatal conductance (gs), b mesophyll conductance (gm), and c net photosynthesis (Anet). The points represent the cuvette means (n = 4) for each hour and day. The blue line is the second order polynomial fit to the data and the shaded grey area is the standard error of the fit

