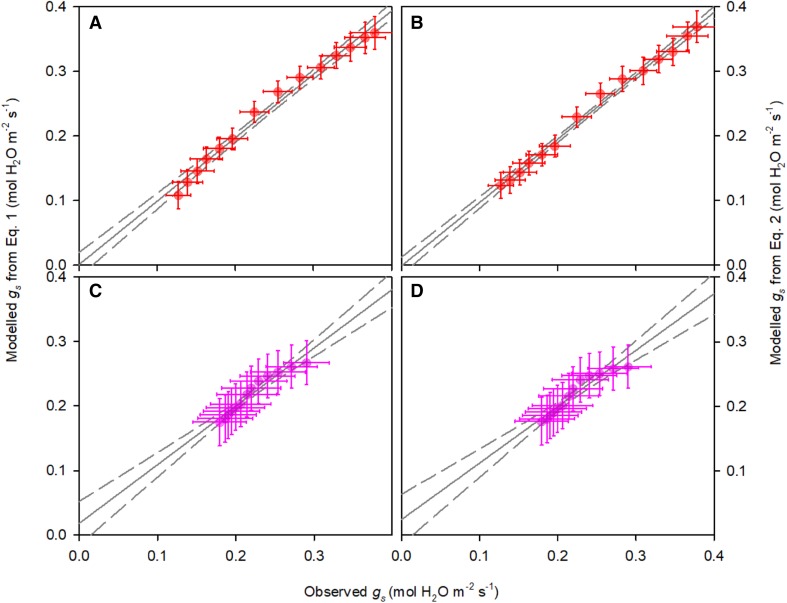
Fig. 2.
Measured versus modelled stomatal conductance (gs). Stomatal conductance was modelled for measurements performed at CO2 concentration in the cuvette of 380 µmol mol−1 and 100% red light with Eq. (1) (Medlyn et al. 2011, panel a) and with the modified model (Eq. 2, panel b) and for measurements using 90% red and 10% blue light and CO2 of 1000 µmol mol−1 with the Medlyn model (panel c) and with the modified model (panel d). Solid and dashed lines show linear regressions and 95% confidence intervals, respectively. Error bars indicate standard errors (n = 6 biological replicates)

