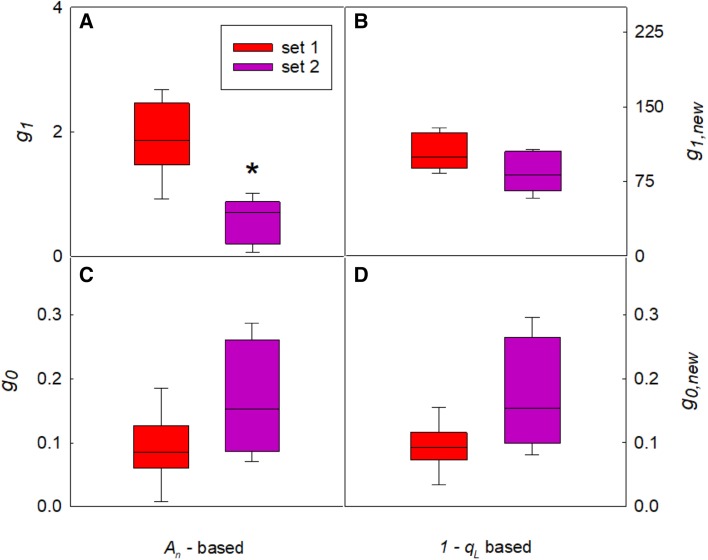
Fig. 3.
Estimated model parameters (g0, g0,new, g1, g1,new) for the stomatal conductance model with either An (panel a and c) or 1 − qL (panel b and d) as the estimator for light-induced stomatal movements. Light response curves were measured with either 100% red light and 380 µmol mol−1 CO2 (set 1) or 90% red and 10% blue light and 1000 µmol mol−1 CO2 (set 2). Asterisk indicates significant difference between parameter estimate for set 1 versus set 2 (p = 0.001, Student’s t test, n = 6)

