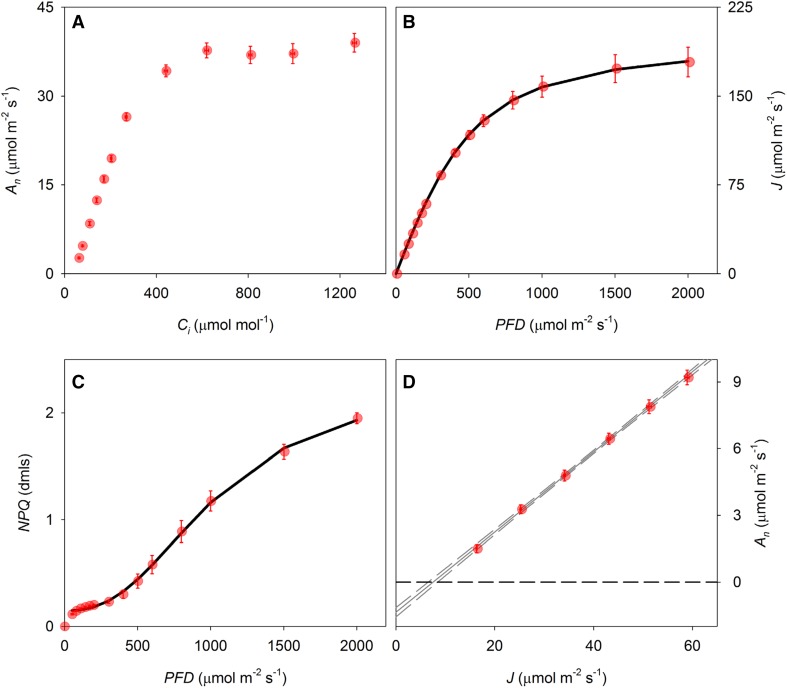
Fig. 4.
Response curves to derive model parameters for the photosynthesis model. Net assimilation rate An plotted as a function of a intercellular CO2 concentration (Ci), b whole-chain electron transport (J) and c non-photochemical quenching (NPQ) plotted as a function of incident light (PFD) and dAn plotted as a function of J. Solid lines in b and c depict model fits (Eqs. 4 and 6). The data in d were used to estimate mitochondrial respiration rate not associated with photorespiration (Rd) as the y intercept of the linear correlation. Solid and dashed lines in d show linear regressions and 95% confidence intervals, respectively. Error bars indicate standard errors (n = 6 biological replicates)

