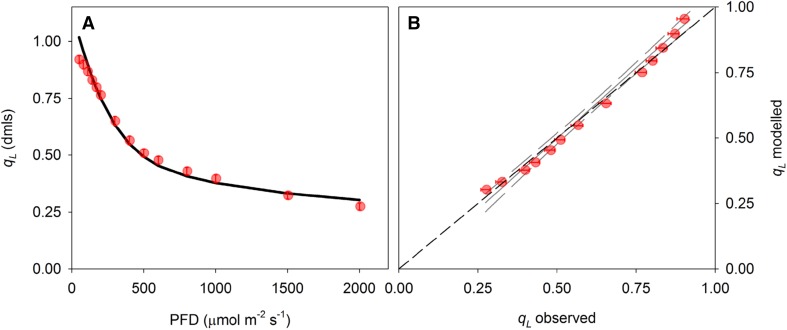
Fig. 6.
a Fluorescence parameter qL as a function of light intensity (PFD), symbols indicate measurements, solid line shows model simulations. b Correlation between observed and modelled qL shown in panel a. Solid and dashed lines in b depict linear regression (y = 1.08x − 0.04) and 95% confidence intervals, respectively. Slope and intercept did not deviate significantly from x = y shown by the black dashed line (p > 0.05). Error bars indicate standard errors (n = 6 biological replicates)

