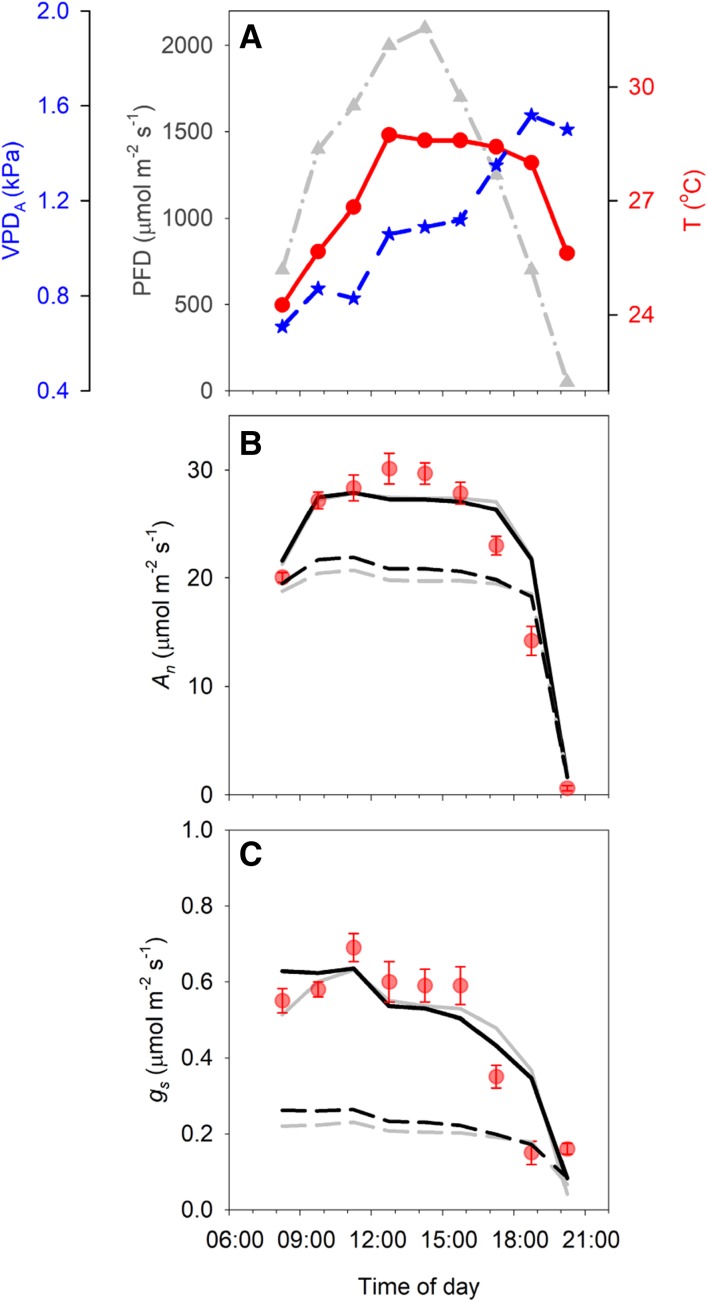
Fig. 8.
a Diurnal measurements of light intensity (PFD), air temperature (T) and air vapour pressure deficit (VPDA) during July 21, 2015 in Urbana, Illinois, USA. b Observed (symbols) and modelled (lines) net assimilation rate (An) at 90 min intervals. Simulations were performed with the coupled photosynthesis-stomatal conductance model, using the weather data in a as input. Lines show model predictions using either the Medlyn (grey lines) or the modified stomatal conductance model (black lines), with parameter estimates from controlled conditions (dotted lines) or re-calibrated on field-grown plants (solid lines) (c) Observed (symbols) and modelled (lines) stomatal conductance (gs). Line legend as explained for b. Error bars indicate standard errors (n = 7–8 biological replicates)

