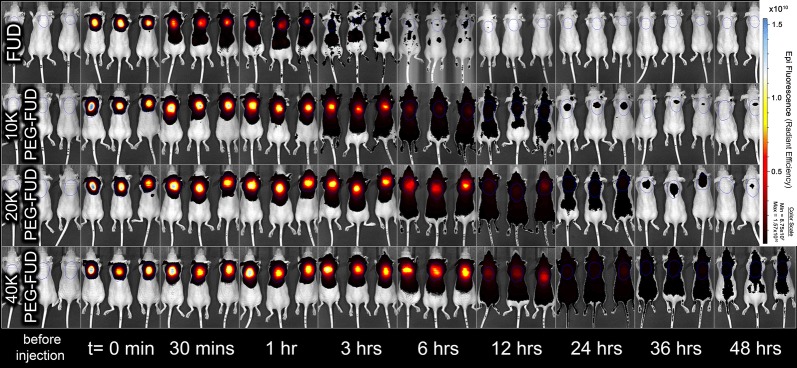
Fig. 7.
In vivo fluorescence imaging of FUD and 10–40 kDa PEG-FUD remaining dose after s.c. administration of a dose containing the peptide and its sulfo-Cy5 conjugate between the shoulder blades of the mouse. A blue circle drawn between the shoulder blades of each animal indicates regions of interest (ROI) used to indicate the location of the dose to quantify the total remaining dose. Same scale (8.75 × 10⁷–1.57 × 10¹⁰) is used to visualize the fluorescence intensity in all images

