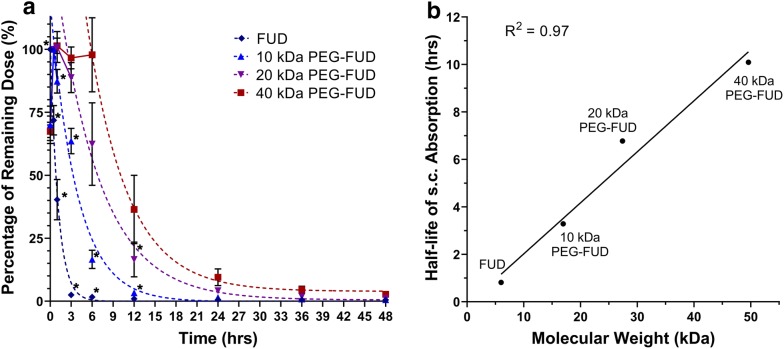
Fig. 8.
a Percentage of drug dose (FSC %) remaining at the site of s.c. injection over time after administration of a FUD or 10 kDa, 20 kDa, or 40 kDa PEG-FUD and a sulfo-Cy5 conjugate dose between the shoulder blades of a mouse. A one phase decay function was applied to the terminal phase of the absorption to calculate FSC % = 50% (t1/2) values. Significance (p ≤ 0.05) of difference between mean FSC % values of a peptide and its larger counterpart is denoted with an asterisk (*). n = 3 b Relationship between apparent half-life (t1/2) of peptide absorption and the peptide’s MW. Linear regression analysis resulted in an r2 correlation coefficient of 0.97

