Figure 3.


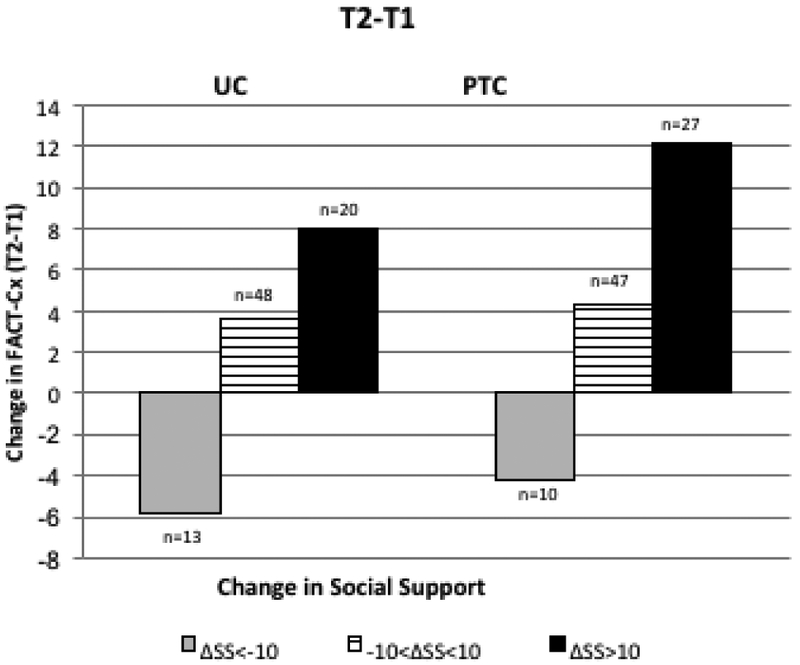
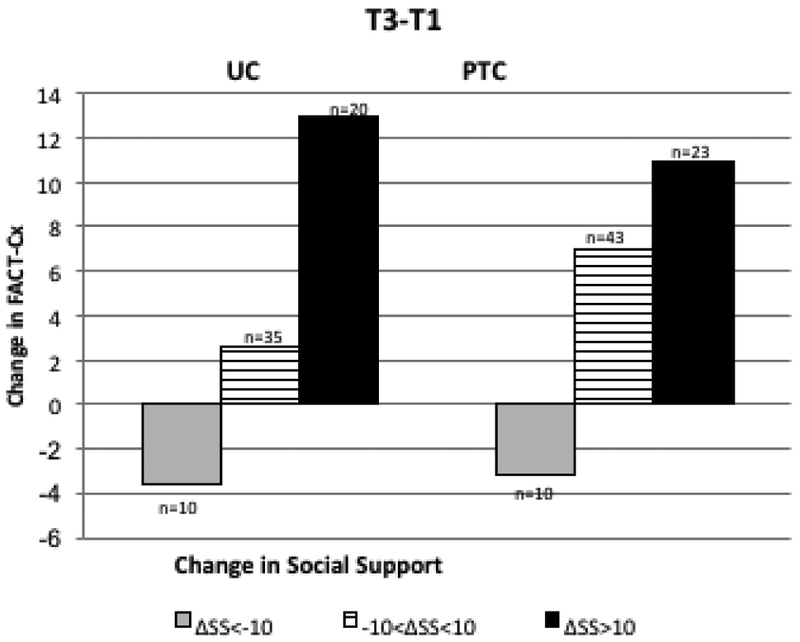
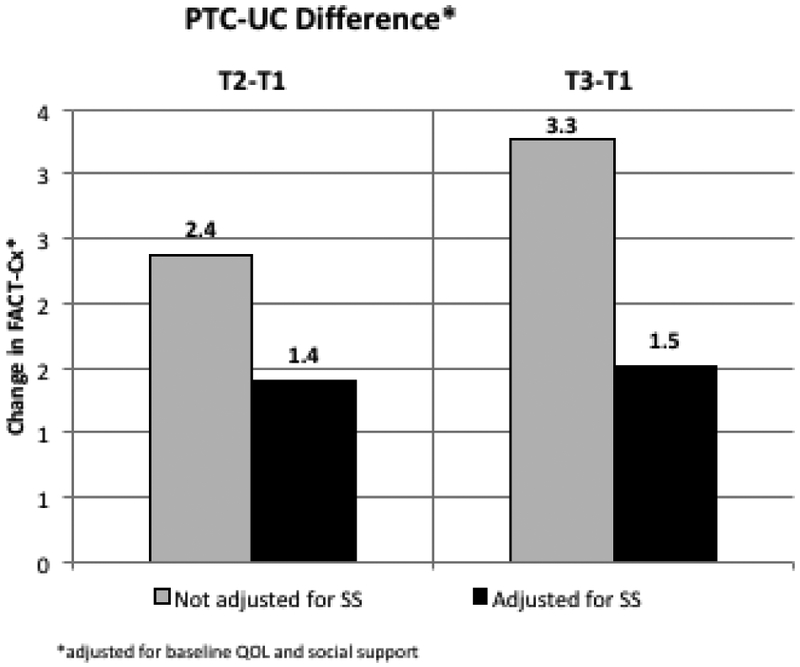
Longitudinal Change in QOL (Fact-Cx) with Change in SS. Changes in SS for PTC and UC are categorized as ΔSS <−10 (dark gray), −10< ΔSS <10 (pattern) and ΔSS>10 (black). 3A: Change in QOL from T1 to T2: trend in QOL change across ΔSS categories is significant (p<0.001) after adjusting for baseline values; 3B: Change in QOL from T1 to T3, trend in QOL change across ΔSS categories is significant (p<0.001) after adjusting for baseline values. 3C: PTC-UC difference in QOL change. Adjustment for SS change reduces the difference in QOL change between PTC and UC from 2.4 to 1.4 (T2-T1) and from 3.3 to 1.5 (T3-T1).
