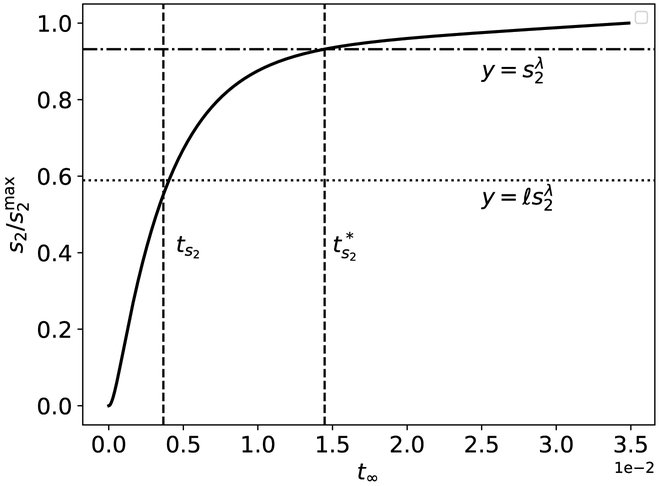
Figure 10: The timescale ts2 is characteristic of the time it takes s2 to reach , and the timescale is the approximate time it takes s2 to reach , respectively, in the auxiliary reaction mechanism (47)–(48).
The thick black curve is the numerically-integrated solution to the mass action equations (49a)–(49d). The leftmost dashed vertical line corresponds to ts2, and the rightmost dashed vertical line corresponds to . The lower dotted horizontal line corresponds to the scaled characteristic value , and the upper dashed/dotted vertical line corresponds to . The constants (without units) used in the numerical simulation are: , , , k1 = 1, k2 = 1, k3 = 1, k−3 = 1, k4 = 2 and k−1 = 1. Time has been mapped to the t∞ scale: t∞(t) = 1 – 1/ln[t + exp(1)], and s2 has been numerically-scaled by its maximum value. For clarity, the mass action equations have been integrated from t = 0 to .

