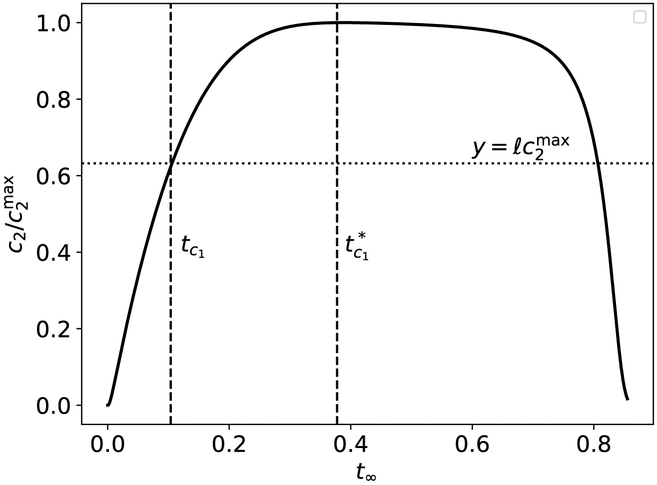
Figure 11: When tc2, ts2 ≪ tc1, the timescale tc1 is characteristic of the time it takes ṗ to reach its maximum, and the timescale is the approximate time it takes c2 to reach its maximum, respectively, in the auxiliary reaction mechanism (47)–(48).
The thick black curve is the numerically-integrated solution to the mass action equations (49a)–(49d). The leftmost dashed vertical line corresponds to tc1, and the rightmost dashed vertical line corresponds to . The lower dotted horizontal line corresponds to the scaled characteristic value . The constants (without units) used in the numerical simulation are: , , , k1 = 0.01, k2 = 1, k3 = 10, k−3 = 1, k4 = 100 and k−1 = 1. Time has been mapped to the t∞ scale: t∞(t) = 1 – 1/ln[t + exp(1)], and c2 has been numerically scaled by its maximum value.

