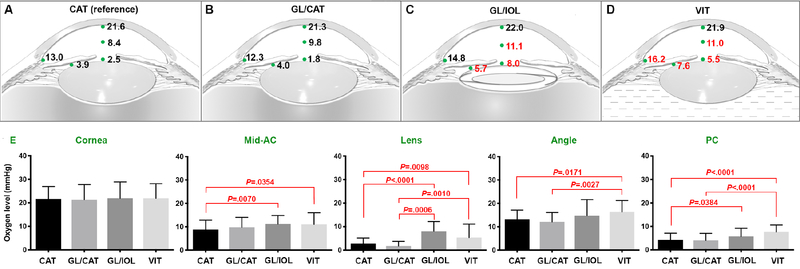
Figure 1.
Intraocular pO2 measurements (mmHg) at indicated locations (green dots). A. Cataract (CAT) group used as reference for comparison with other groups. Red numbers indicate P values <.05. B. GL/CAT = glaucoma diagnosis with cataract C. GL/IOL = glaucoma diagnosis with history of prior cataract surgery D. VIT = history of prior pars plana vitrectomy. E. Comparison of pO2 at intraocular locations. (ANOVA with multiple comparison analysis and Bonferroni correction; P values <.05). Error bar: mean mmHg ± standard deviation.

