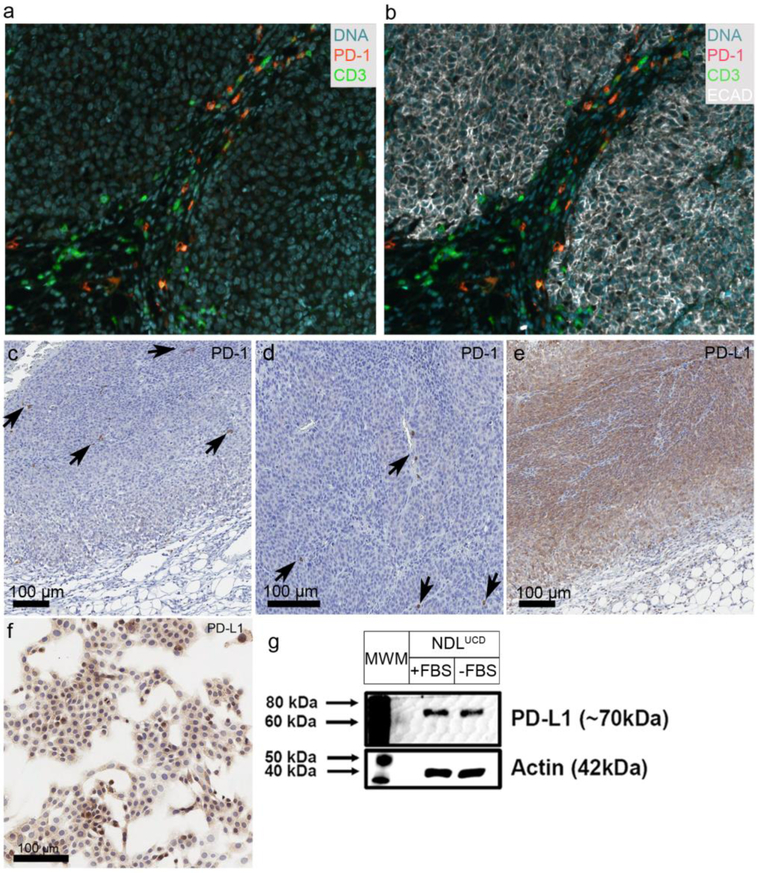
Figure 5:
PD-1 and PD-L1 expression in the NDLUCD model. a) b) PD-1, CD3, ECAD expression stained with multiplex IHC. c) d) PD-1 expressing immune cells. The arrows indicate PD-1 positive cells. e) Positive PD-L1 staining, with typical zonal distribution of staining intensity. f) PD-L1 IHC on cell culture. g) PD-L1 western blot for cultured NDLUCD cells.

