
Figure 4.
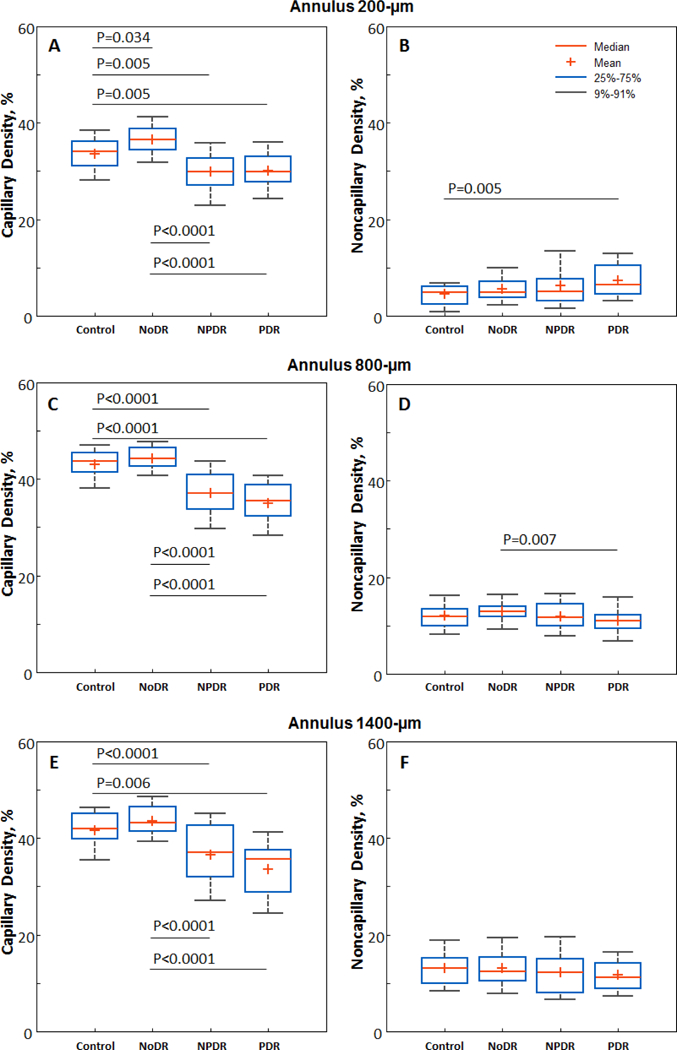
Boxplots of PCD (left column) and noncapillary blood vessel density (right column) measured at the A & B) 200-µm, C & D) 800-µm, and E &F) 1400-µm annuli. Brackets indicate statistically significant differences between corresponding study groups.