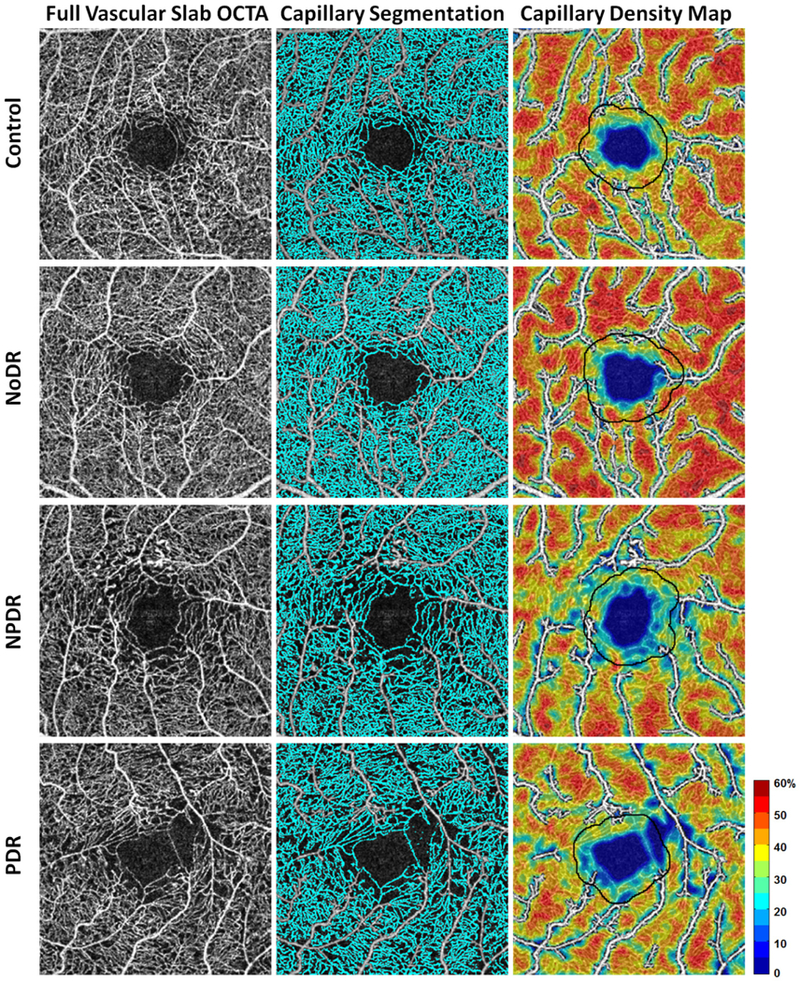
Figure 5.

Comparison of PCD maps in a healthy control and patients with various stages of diabetic retinopathy. Left column) Contrast-stretched full vascular slab OCTA. Middle column) Corresponding capillary segmentation highlighted in cyan. Right column) Corresponding PCD maps with noncapillary blood vessels indicated in white. The 200-µm annuli are delineated in all subjects for easier comparison.
