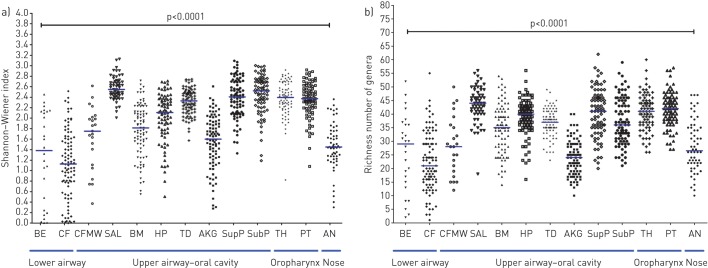
FIGURE 1.
a) Taxa diversity (Shannon–Wiener diversity index) and b) taxa richness (counts of observed taxa per sample) for the 13 cohorts. Data are presented as intracohort spread with the horizontal line showing median values. Differences between pairs were evaluated using the Mann–Whitney test with Bonferroni adjustment (p<0.05 denoted significant differences). BE: bronchiectasis sputum; CF: cystic fibrosis sputum; CFMW: cystic fibrosis mouthwash; SAL: saliva; BM: buccal mucosa; HP: hard palate; TD: tongue dorsum; AKG: attached keratinised gingiva; SupP: supragingival plaque; SubP: subgingival plaque; TH: throat; PT: palatine tonsils; AN: anterior nares.

