Figure 3.

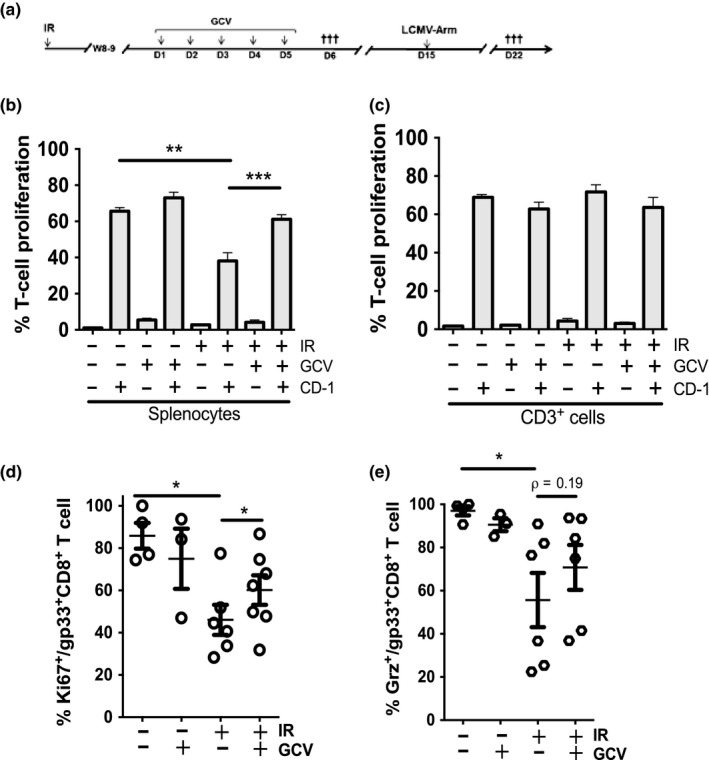
IR impairs T‐cell proliferation in vitro and in vivo. (a) Schematic of the experimental design. 12‐week‐old p16‐3MR mice were exposed to 6.5 Gy total body irradiation, and 8–9 weeks later, mice were treated or not with GCV for 5 consecutive days. On day 6 (D6), mice were sacrificed and splenocytes were collected and labeled with CFSE. Alternatively, on day 15 (D15), mice were injected with the LCMV‐Arm and sacrificed 1 week later. (b, c) The proportion of CD3+ cell undergoing proliferation following an allogenic stimulus was determined by flow cytometry. In panel b, the proliferation of T cells was determined from gated CFSE‐CD3+ cells from p16‐3MR splenocyte responder cells mixed with CD‐1 stimulator splenocytes (ratio 1:2). In panel c, the proliferation of T cells was determined from gated CFSE‐CD3+ from purified CD3+ responder cells mixed with CD‐1 stimulator splenocytes (ratio 1:2). (d) Quantification of the capability of splenic T cells to proliferate in vivo following the injection of mice with the LCMV‐Arm. Shown is the proportion of gp33+CD8+ T cells undergoing LCMV‐specific proliferation as determined by flow cytometry for the expression of the Ki67 proliferation marker. (e) Shown is the proportion of gp33+CD8+ T cells expressing granzyme B (Grz) as determined by flow cytometry. For all graphs, the average ± SEM is shown from n = 5–7 mice except for panels d and e where each dot represents counts from an individual mouse. The ρ value was determined by a one‐way ANOVA, ***p < 0.001; **p < 0.01; *p < 0.05
