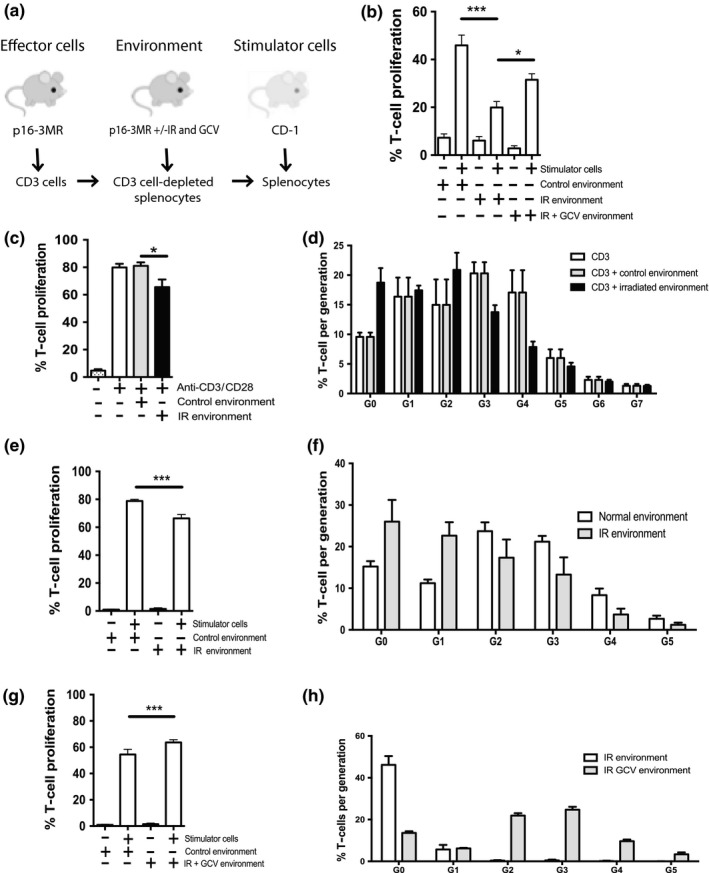
Figure 4.

The irradiated splenic environment impairs T cell proliferation. (a) Schematic of the experimental design. CD3+ effector cells were isolated by negative selection from the spleens of p16‐3MR mice and labeled with CFSE. The splenic environment corresponds to CD3+ T cell‐depleted splenocytes from p16‐3MR mice previously (8–9 weeks) exposed (+) or not (−) to IR and treated or not with GCV. Stimulator cells were freshly irradiated (30 Gy) allogenic splenocytes collected from a CD‐1 mouse. (b) Shown is the proportion of effector CD3+ cell undergoing proliferation in the presence of the indicated splenic environment following an allogenic stimulus (CD‐1 stimulator). T cell proliferation was determined by flow cytometry (CFSE dilution). (c) Shown is the proportion of effector CD3+ cell undergoing proliferation following stimulation with anti‐CD3/anti‐CD28‐coated beads in the lower well of a Transwell plate with the indicated (control or IR) splenic environment in the top well. (d) Quantification of the number of cell generation as determined by flow cytometry by gating for each CFSE dilution peak obtained from the proliferation conditions shown in panel C. (e) Shown is the proportion of CD3+ cell undergoing proliferation following an allogenic stimulus (CD‐1 stimulator) in the lower well of a Transwell plate with the indicated splenic environment (control or IR) in the top well. (f) Quantification of the number of cell generation as determined from the proliferation conditions shown in panel E. (g) Shown is the proportion of CD3+ cell undergoing proliferation following an allogenic stimulus (CD‐1 stimulator) in the lower well of a Transwell plate and the indicated splenic environment (IR or IR + GCV) in the top well. (h) Quantification of the number of cell generation as determined from the proliferation conditions shown in panel g. Shown is the average ± SEM from n = 5–7 mice. Data were analyzed by one‐way analysis of variance (ANOVA). ***p < 0.001; *p < 0.05
