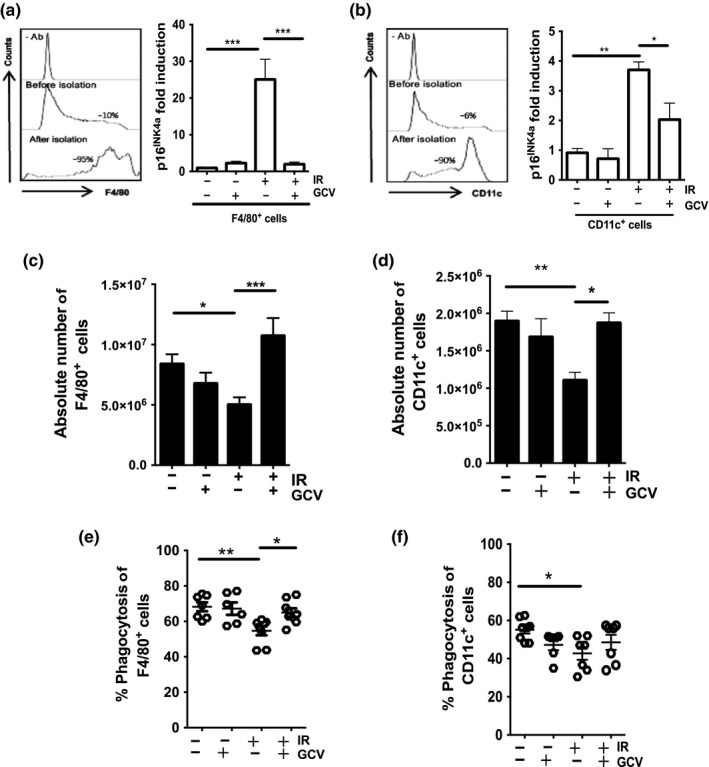
Figure 5.

Impaired macrophage and DC counts and function in the splenic environment. (a, b) Shown are the purity (left panels) and quantification of p16INK4a mRNA levels (right panels) of isolated F4/80+ macrophages and CD11c+ DC cell populations as determined by flow cytometry and qPCR, respectively. 18S ribosomal RNA used as an internal control. (c, d) Shown is the quantification by flow cytometry of the absolute cell counts per spleens for F4/80+ and CD11c+ cell populations, respectively, collected from mice treated as indicated. Cell counts were determined 1 day following the last injection of GCV. (e, f) Quantification of the proportion of purified F4/80+ macrophages and CD11c+ DC populations capable of phagocytosis. Shown is the average ± SEM from n = 7–15 mice per group except for panels e and f where each dot represents counts from an individual mouse. The ρ value was determined by a one‐way ANOVA. ***p < 0.001; **p < 0.01; *p < 0.05
