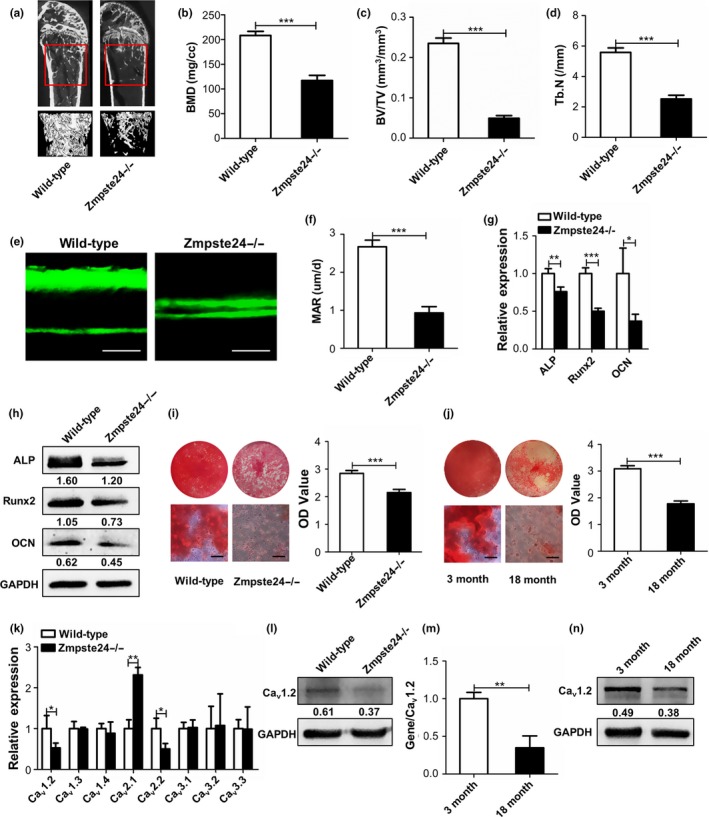
Figure 1.

Cav1.2 is downregulated in aging BMMSCs with impaired osteogenic differentiation. (a) Bone masses of 3‐month‐old wild‐type and Zmpste24‐deficient mice were tested by micro‐CT (n = 3), and the “interesting zone” was highlighted. (b–d) Bone mineral density (BMD), bone volume/total volume (BV/TV), and trabecular number (Tb.N) of 3‐month‐old wild‐type and Zmpste24‐deficient mice were analyzed with the micview software. (e) Bone formations of 3‐month‐old wild‐type and Zmpste24−/− mice were examined by double‐calcein labeling (n = 3). Scale bar, 25 um. (f) Mineral apposition rate (MAR) was analyzed by Image J under fluorescence microscope. (g) Expressions of osteogenic‐related genes of ALP, Runx2, and OCN in wild‐type and Zmpste24‐deficient mice were detected by qRT–PCR after osteogenic induction for 5 days (n = 3). The results were normalized to GAPDH. (h) Expressions of osteogenic‐related proteins of ALP, Runx2, and OCN in wild‐type and Zmpste24‐deficient mice were detected by Western blot after osteogenic induction for 7 days (n = 3). GAPDH was used as an internal control. (i) Mineralized nodules of BMMSCs from wild‐type and Zmpste24‐deficient mice were assayed by alizarin red staining after osteogenic induction for 14 days and quantified with a spectrophotometer after dissolving with cetylpyridinium chloride (n = 3). (j) Alizarin red staining was performed to detect mineralized nodules of BMMSCs from 3‐month‐old to 18‐month‐old normal mice after osteogenic induction for 14 days and quantified with a spectrophotometer after dissolving with cetylpyridinium chloride (n = 3). (k) Expressions of voltage‐gated Ca2+ channels (VGCCs) related genes in 3‐month‐old wild‐type and Zmpste24‐deficient mice were explored by qRT–PCR (n = 7). The results were normalized to GAPDH. (l) The protein level of Cav1.2 in 3‐month‐old wild‐type and Zmpste24‐deficient mice was explored by Western blot (n = 7). (m) Expression of Cav1.2 in 3‐month‐old young mice and 18‐month‐old natural aging mice was explored by qRT–PCR (n = 7). The results were normalized to GAPDH. (n) The protein level of Cav1.2 in 3‐month‐old young mice and 18‐month‐old natural aging mice was explored by Western blot (n = 7). Scale bar of alizarin red, 50 um. Data are shown as mean ± SD. *p < 0.05, **p < 0.01, ***p < 0.001, which was determined by unpaired two‐tailed Student's t test
