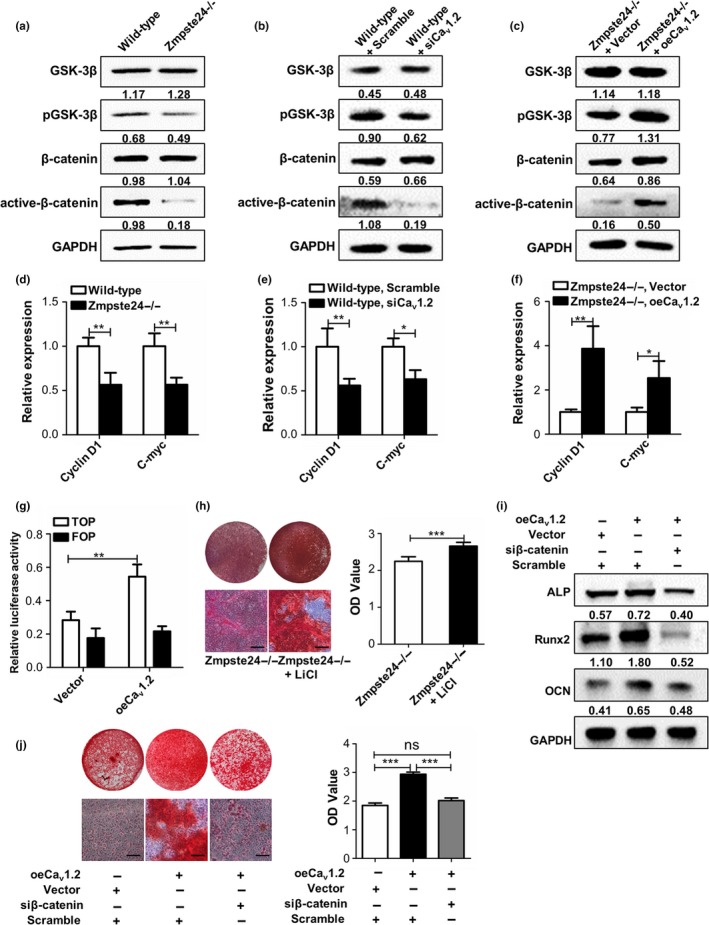
Figure 3.

Cav1.2 upregulates osteogenic differentiation of BMMSCs via Wnt/β‐catenin pathway. (a) Expressions of GSK3β, p‐GSK3β, β‐catenin, and active‐β‐catenin in wild‐type and Zmpste24−/− BMMSCs were detected by Western blot analysis (n = 7). (b) Wild‐type BMMSCs were transfected with scramble siRNA or Cav1.2 siRNA, and the protein expression levels of GSK3β, p‐GSK3β, β‐catenin, and active‐β‐catenin were confirmed by Western blot analysis after 72 hr (n = 3). (c) Zmpste24−/− BMMSCs were transfected with control overexpression vector or Cav1.2 plasmid, and the protein expression levels of GSK3β, p‐GSK3β, β‐catenin, and active‐β‐catenin were confirmed by Western blot analysis after 72 hr (n = 3). (d) Wnt target genes of cyclin D1 and c‐myc were explored in wild‐type and Zmpste24−/− BMMSCs by qRT–PCR (n = 7). (e) Wild‐type BMMSCs were transfected with scramble siRNA or Cav1.2 siRNA, and Wnt target genes of cyclin D1 and c‐myc were explored by qRT–PCR (n = 3). (f) Zmpste24−/− BMMSCs were transfected with control overexpression vector or Cav1.2 plasmid, and Wnt target genes of cyclin D1 and c‐myc were explored by qRT–PCR (n = 3). (g) 48 hr after transfection with control overexpression vector or Cav1.2 plasmid in progerin‐overexpressed 293T cells, TOP/FOP, and Renilla luciferase plasmid were transfected, and TOP/FOP reporter assay was performed to detect the activity of β‐catenin after 24 hr (n = 3). (h) Alizarin red staining of Zmpste24−/− and 5 mM LiCl‐treated Zmpste24−/− BMMSCs was performed to detect mineralized nodules after osteogenic induction for 14 days (n = 3). (i) Expressions of osteogenic‐related proteins of ALP, Runx2, and OCN in Zmpste24−/− BMMSCs from control group, Cav1.2‐overexpressed and Cav1.2‐overexpressed in the context of β‐catenin siRNA were detected by Western blot after osteogenic induction for 7 days (n = 3), and each group contains equal volume of transfection agent. (j) Alizarin red staining of Zmpste24−/− BMMSCs from control group, Cav1.2‐overexpressed and Cav1.2‐overexpressed in the context of β‐catenin siRNA were performed after osteogenic induction for 14 days (n = 3), and each group contains equal volume of transfection agent. The expression levels of the target proteins were normalized to GAPDH. Scale bar, 50 um. Data are shown as mean ± SD. *p < 0.05, **p < 0.01, ***p < 0.001, which was determined by paired two‐tailed Student's t test
