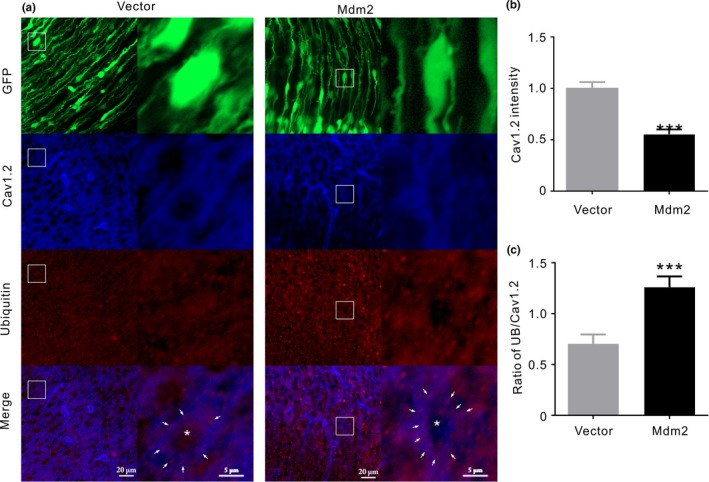
Figure 4.

Mdm2 reduces Cav1.2 protein and enhances Cav1.2 ubiquitination in vivo. (a) Immunofluorescent images of cortical slices. Cells are successfully transfected with vector and Mdm2 as shown by green fluorescence (GFP). Cav1.2 and ubiquitin are shown as blue and red, respectively, whereas the merged images showing the colocalization of Cav1.2 and ubiquitin are shown as purple (Merge). The two columns under Vector or Mdm2 show general arrangement of cells (left) and the amplified view of immunofluorescence (right) from the rectangles marked in the left sides, respectively. The white arrows denote the purple dots indicating the colocalization of Cav1.2 and ubiquitin, whereas asterisk denotes the central area of cell body. (b) Quantitative analysis of Cav1.2 intensity between vector and Mdm2 (n = 36 cells/ 6 slices in each). (c) Quantitative analysis of ubiquitin intensity per Cav1.2 unit in cells transiently expressing vector or Mdm2 (n = 36 cells/ 6 slices in each). ***p<0.001, unpaired t test
