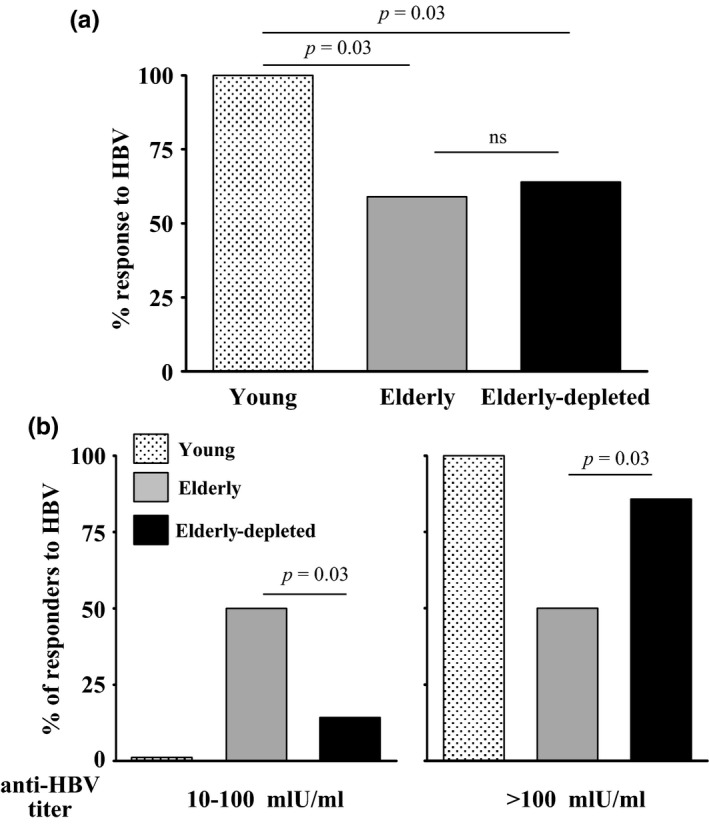
Figure 5.

Humoral anti‐HBV response obtained in elderly B‐cell‐depleted patients relative to elderly and young healthy volunteers. Individuals from the indicated groups were vaccinated with HBV, and anti‐HBV antibody responses were determined as detailed in the methodology section. (a) Graph depicts percent of responders to HBV (antibody titers of ≥10 mIU/ml) for each group. (b) Graph depicts distribution of HBV responders developing titers of 10–100 mlU/m and those developing titers of >100 mlU/ml
