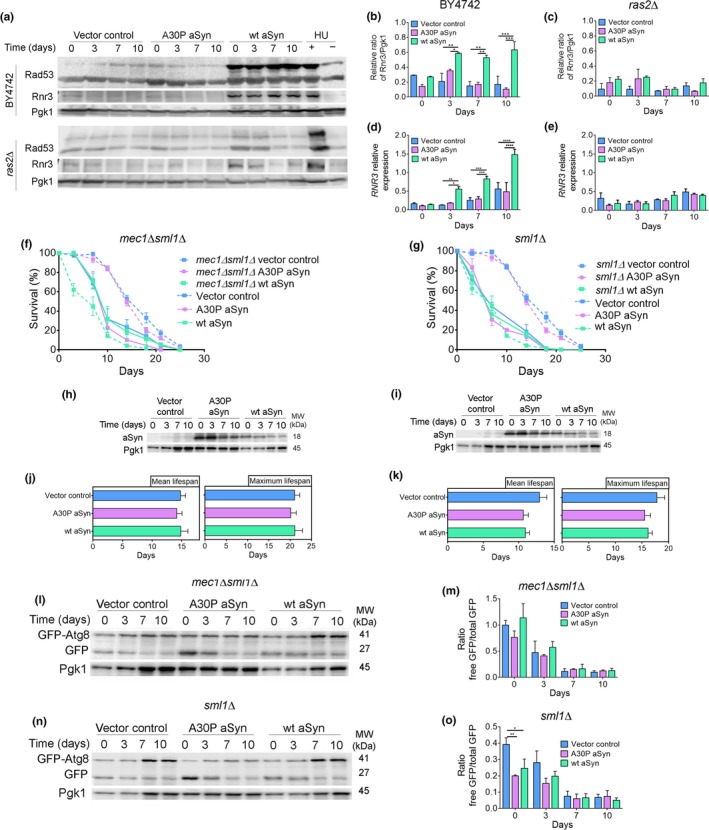
Figure 3.

aSyn promotes DNA damage responses. (a) Representative blots for Rad53 phosphorylation and Rnr3 levels. (b,c) Graphical representation of the Rnr3/Pgk1 and (d,e) relative RNR3mRNA levels of BY4742 or ras2Δ cells expressing the vector control or aSyn variants, respectively. As a positive or negative control of DDR activation, cells treated or not with hydroxyurea (HU) were used. Significance of the data was determined by two‐way ANOVA (*p ≤ 0.05, **p ≤ 0.01, ***p ≤ 0.001, ****p ≤ 0.0001) comparing BY4742 or ras2Δ cells expressing vector control or the aSyn variants. (f,g) CLS and (h,i) aSyn levels of mec1Δsml1Δ and sml1Δ cells, respectively, expressing the vector control or aSyn variants (CLS data from W303‐1A wild‐type cells, dashed lines, are repeated from Supporting information Figure S3 to facilitate interpretation). (j,k) Mean lifespan and maximum lifespan of mec1Δsml1Δ and sml1Δ cells. (l,n) Representative blots and (m,o) graphical representation of the GFP‐Atg8 processing assay. Significance of the data was determined by two‐way ANOVA (*p ≤ 0.05, **p ≤ 0.01) comparing mec1Δsml1Δ or sml1Δcells expressing vector control or aSyn variants
