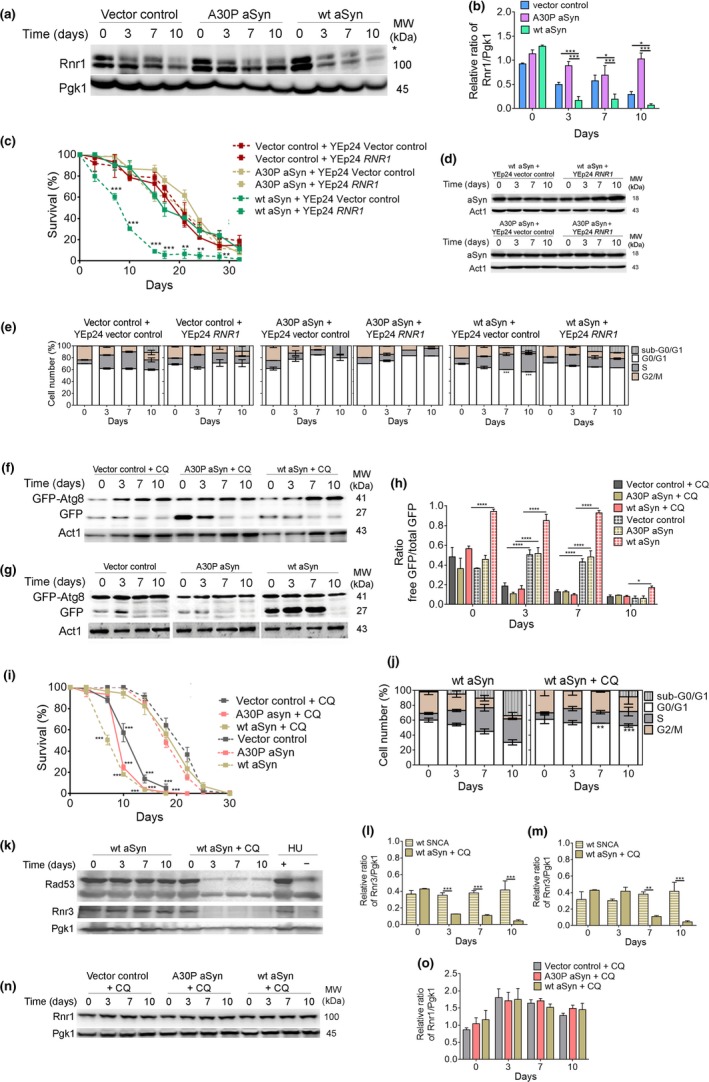
Figure 4.

Decreased levels of Rnr1 in aSyn‐expressing cells are restored by autophagy inhibition. (a) Representative blot for Rnr1 of BY4742 cells expressing the vector control or aSyn variants and (b) graphical representation of the Rnr1/Pgk1. *indicates a nonspecific band in the anti‐Rnr1 immunoblot. Significance of the data was determined by two‐way ANOVA (*p ≤ 0.05, ***p ≤ 0.001) comparing wild‐type cells expressing the vector control or the aSyn variants. (c) CLS, (d) aSyn levels, and (e) cell cycle analysis of BY4742 cells co‐expressing the vector control or aSyn variants and RNR1 or vector control. Significance of the data was determined by two‐way ANOVA (**p ≤ 0.01; ***p ≤ 0.001) comparing cells co‐expressing RNR1 and the vector control or aSyn variants. (f,g) Representative blots of the GFP‐Atg8 processing assay of BY4742 cells expressing the vector control or aSyn variants in the presence or absence of chloroquine (CQ) (50 µg/µl added at day 0 of CLS). (h) Graphical representation of the GFP‐Atg8 processing assay. (i) CLS of BY4742 cells expressing the vector control or aSyn variants in the presence (solid lines) or absence (dashed lines) of CQ. (j) Cell cycle analysis of BY4742 cells expressing wt aSyn treated or not with CQ. (Data on Figure 4g,I,j for BY4742 cells expressing the vector control or aSyn variants without CQ are repeated from Figure 1 to facilitate interpretation). Significance of the data from h–j was determined by two‐way ANOVA (*p ≤ 0.05, **p ≤ 0.01; ***p ≤ 0.001, ****p ≤ 0.0001) comparing BY4742 cells expressing the vector control or aSyn variants in the presence or absence of CQ. (k) Representative blots for Rad53 phosphorylation and Rnr3. (l) Graphical representation of the Rnr3/Pgk1 and (m) relative RNR3mRNA levels of BY4742 cells expressing wt aSyn in the absence or presence of CQ. As a positive or negative control for DDR activation, extracts from cells treated with hydroxyurea (HU) were used. Significance of the data was determined by Student's t test (**p ≤ 0.01; ***p ≤ 0.001) comparing BY4742 cells expressing the vector control or aSyn variants in the presence or absence of CQ. (n) Representative blot for Rnr1 and (o) graphical representation of the Rnr1/Pgk1 of BY4742 cells expressing the vector control or aSyn variants treated with CQ
