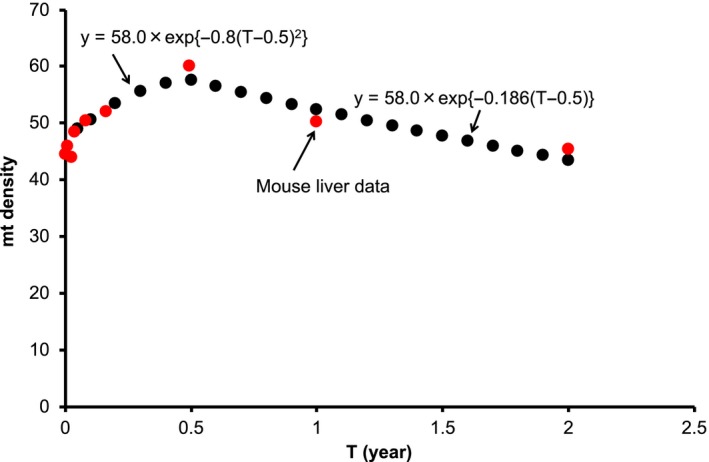
Figure 5.

Age dependency of the mt density in mouse liver. There is precedent data demonstrating the age dependency of the mt density in mice (Nagata, 2006). We rewrote the metabolic rate function F(T) in Equation 2 as F(T) = F 0 × exp{−30u(T − 0.5)} = 58.0 × exp{−0.186(T − 0.5)}, in which the maximum lifespan (120 years) of a human was scaled down to that (4 years) of a mouse. We used the decay constant u = 0.00624 for liver (Section 4.3). The function y = 58.0 × exp{−0.8(T − 0.5)2} was deduced so as to reproduce the data in the period of development up to adulthood (T ≤ 0.5 years)
