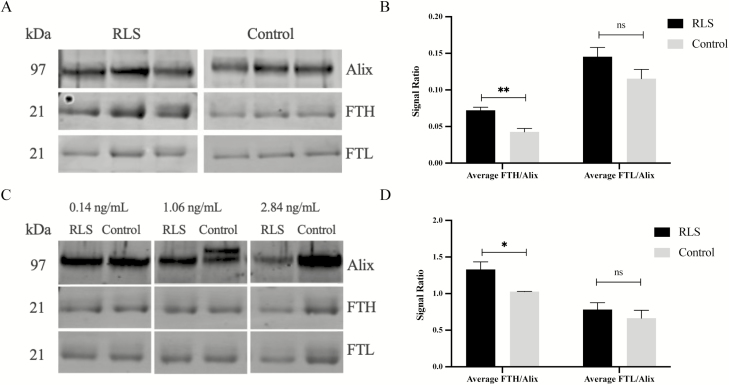
Figure 2.
Altered Ferritin profile in L1CAM + nEVs in RLS. (A, B) People with RLS with the highest ferritin concentration and Control participants with the lowest ferritin concentrations were selected. Western blot (WB) image shows heavy-chain ferritin (FTH), light-chain ferritin (FTL), and Alix, a common nEV marker used for normalization. Normalized FTH was higher (** depicts p = 0.009) in people with RLS compared with Controls; there were no differences in FTL (ns refers to p = 0.17). (C, D) People with RLS and Controls with equivalent ferritin concentrations were selected. Normalized FTH was again higher (* depicts p = 0.04) in people with RLS compared with Controls; again there were no differences for FTL (ns refers to p = 0.45). Graphs depict mean ± SEM.

