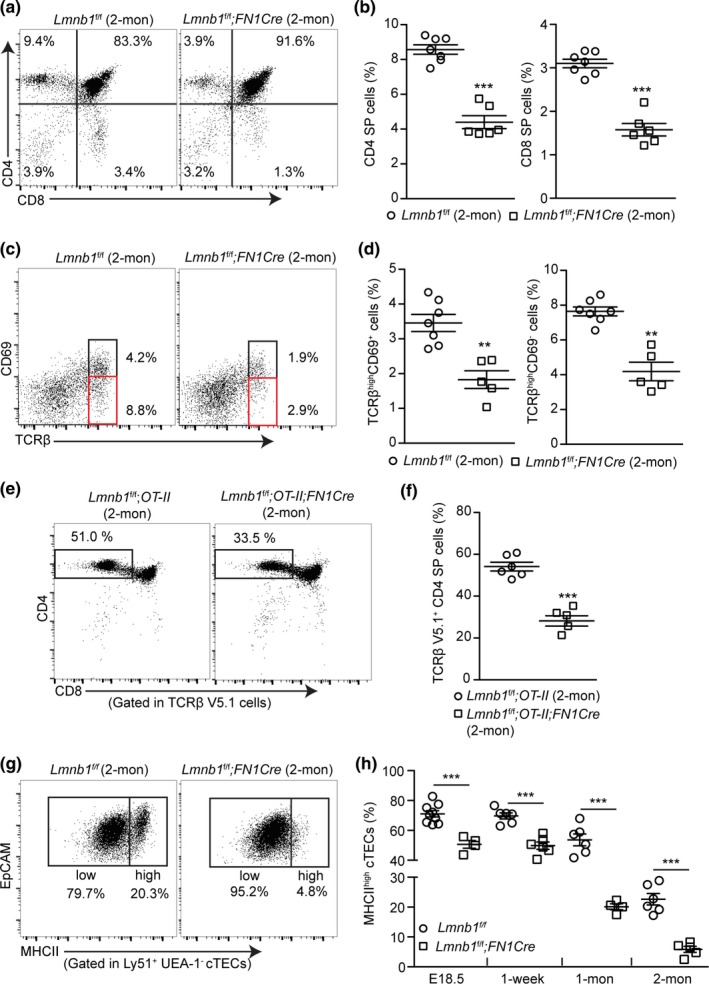
Figure 2.

Effects of developmental TEC Lmnb1 deletion on the positive selection of αβT cells in mouse thymus. (a) Representative flow cytometry profiles showing a reduction of CD4+ single‐positive (CD4+ SP) and CD8+ SP thymocytes in the 2‐mon‐old Lmnb1f/f;FN1Cre mouse thymuses compared to that of the Lmnb1f/f controls. (b) Quantifications of the frequency of CD4+ and CD8+ SP thymocytes within the gated live cells in the 2‐mon‐old Lmnb1f/f control (n = 7) and Lmnb1f/f;FN1Cre (n = 6) mouse thymuses. (c) Flow cytometry analysis of TCRβ and CD69 expression on thymocyte subsets undergoing positive selection in 2‐mon‐old Lmnb1f/f control and Lmnb1f/f;FN1Cre mouse thymuses. Black and red boxes show the TCRβhighCD69+ or TCRβhighCD69− thymocytes. (d) Quantification of the frequency of the TCRβhighCD69+ and TCRβhighCD69− cells in the 2‐mon‐old Lmnb1f/f control (n = 7) and Lmnb1f/f;FN1Cre (n = 5) mouse thymuses. (e) Flow cytometry analysis showing a reduction of CD4+ SP thymocytes in the 2‐mon‐old Lmnb1f/f;OT‐II;F1NCre thymuses (n = 5) compared to the Lmnb1f/f;OT‐II thymuses (n = 6). (f) Quantification of the frequency of CD4+ SP thymocytes within the gated OT‐II transgenic TCR (TCRβ V5.1) thymocytes in experiments shown in (e). (g) Representative flow cytometry plots of staining for MHCIIhigh and MHCIIlow cTECs from 2‐mon‐old Lmnb1f/f and Lmnb1f/f;FN1Cre thymuses. (h) A summary showing the reduction of the most differentiated MHCIIhigh cTECs in the Lmnb1f/f;FN1Cre thymuses compared to the Lmnb1f/f control thymuses at the indicated ages. Each circle or square represents one Lmnb1f/f control or Lmnb1f/f;FN1Cre mouse, respectively. Error bars, SEM from at least four independently analyzed mice. Student's t test: *p < 0.05, **p < 0.01, ***p < 0.001; ns, not significant
