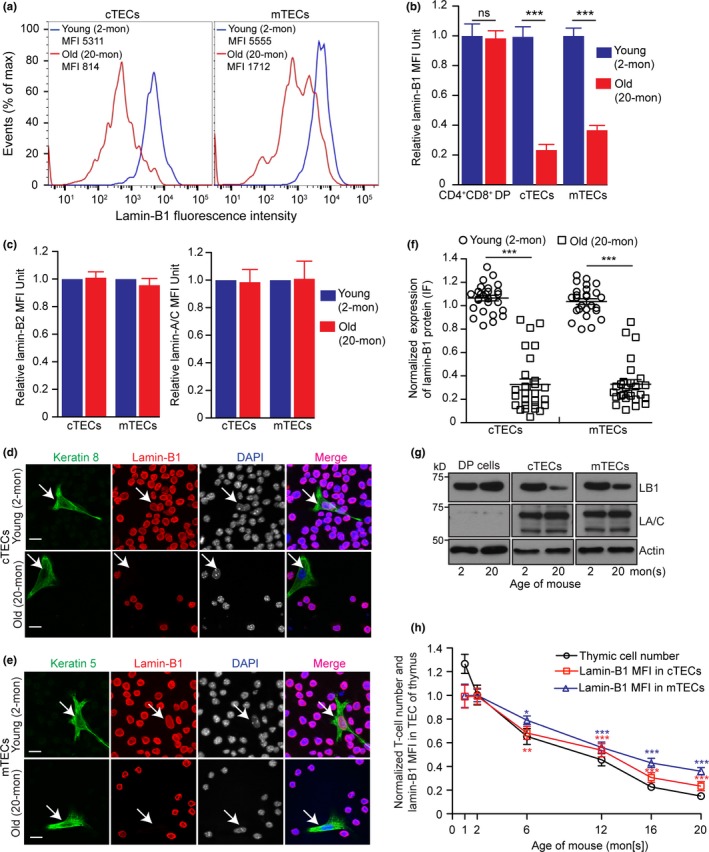
Figure 3.

Effects of aging on lamin‐B1 protein levels in TECs. (a) Flow cytometry analyses of lamin‐B1 levels in cTECs (left) and mTECs (right) from 2‐ (young, blue) or 20‐mon‐old (old, red) wild‐type mouse thymuses. Shown are representative histogram plots (out of >3 independent experiments) with the mean fluorescence intensities (MFI) of lamin‐B1 indicated. (b) Quantification of lamin‐B1 MFI in the CD4+CD8+ double‐positive (DP) thymocytes, cTECs, and mTECs in the young and old WT mouse thymuses. (c) Quantification of lamin‐B2 (left) and lamin‐A/C (right) MFI in the cTECs and mTECs in the young and old WT mouse thymuses from two mice analyzed on different days. (d,e) Immunostaining of lamin‐B1 (red) in cTECs (d) and mTECs (e) along with the spiked‐in RAW264.7 cells (ATCC, #TIB‐71) as an internal control for lamin‐B1 staining intensity. Keratin 8 or 5 (green) labels cTECs (d) or mTECs (e) isolated from 2‐ or 20‐mon WT mouse thymuses, respectively. (f) Quantification of lamin‐B1 fluorescence intensity in cTECs or mTECs from (d) and (e). The average lamin‐B1 fluorescence intensity in TECs and the surrounding spiked‐in RAW264.7 cells were measured, and the TEC lamin‐B1 fluorescence intensities were plotted relative to the lamin‐B1 intensity in spiked‐in RAW264.7 cells which was set to 1. 25 cTECs or mTECs were measured in three independent experiments. (g) Western blotting analyses of lamin‐B1 and lamin‐A/C in CD4+CD8+ DP cells, cTECs, or mTECs in 2‐ or 20‐mon thymuses. One 2‐mon‐old or five pooled 20‐mon‐old thymuses were used for each Western blotting analysis. β‐actin is used for loading control. Shown is one representative Western blot of two independent experiments. (h) Quantification of the total thymic cell numbers (black) and lamin‐B1 MFI in cTECs (red) or mTECs (blue) at the indicated ages. Total thymic cell number or MFI of lamin‐B1 in cTECs or mTECs was plotted relative to those of 2‐mon WT thymus, which was defined as 1 (≥three independent experiments). Error bars, SEM. Scale bars, 20 μm. Student's t test: *p < 0.05, **p < 0.01, ***p < 0.001, ns: not significant
