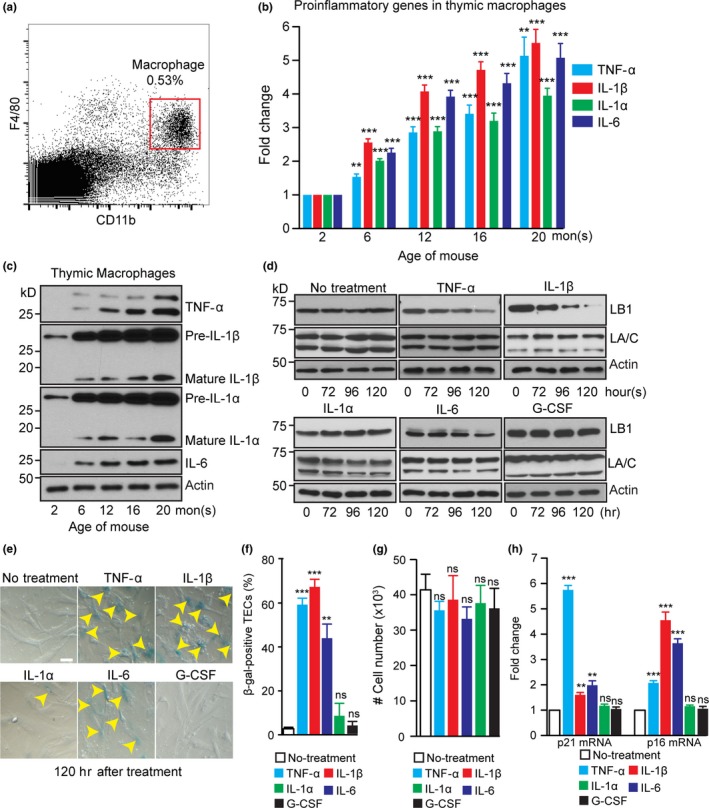
Figure 4.

Effects of inflammatory cytokines on the TEC lamin‐B1 level. (a) The flow cytometry gating strategy for sorting macrophages from a 2‐mon‐old WT thymus. Macrophages were identified based on the expression of F4/80 and CD11b. (b) RT–qPCR analyses of TNF‐α, IL‐1β, IL‐1α, and IL‐6 in macrophages isolated from WT thymuses at the indicated ages. The increased expression was plotted relative to the 2‐mon‐old thymus, which was set to 1. (c) A representative Western blotting analysis of TNF‐α, IL‐1β, IL‐1α, and IL‐6 in macrophages isolated from WT thymuses at the indicated ages. β‐actin, loading control. (d) Western blotting analyses of lamin‐B1 and lamin‐A/C in cultured primary TECs treated with TNF‐α (10 ng/ml), IL‐1β (20 ng/ml), IL‐1α (20 ng/ml), IL‐6 (20 ng/ml), and G‐CSF (20 ng/ml) for the indicated hours. (e) Increased TEC senescence as judged by β‐galactosidase staining (yellow arrowheads) upon treatment by TNF‐α, IL‐1β, and IL‐6, but not by IL‐1α and G‐CSF. (f) Quantification of the percentage of β‐galactosidase‐positive primary TECs. Total 150 cells from 3 biological replicates were counted for each experiment. (g) The cell number counts from in vitro cultured primary TECs after treating with indicated inflammatory cytokines for 120 hr. 5 x10⁴ freshly isolated mature TECs were plated in each condition. (h) RT–qPCR analyses showing the up‐regulation of p21 and p16 in the primary TECs upon treatment with the indicated proinflammatory cytokines. Scale bar, 20 μm. Error bars, SEM from three biological repeats. Student's t test: *p < 0.05, **p < 0.01, ***p < 0.001, ns: not significant
