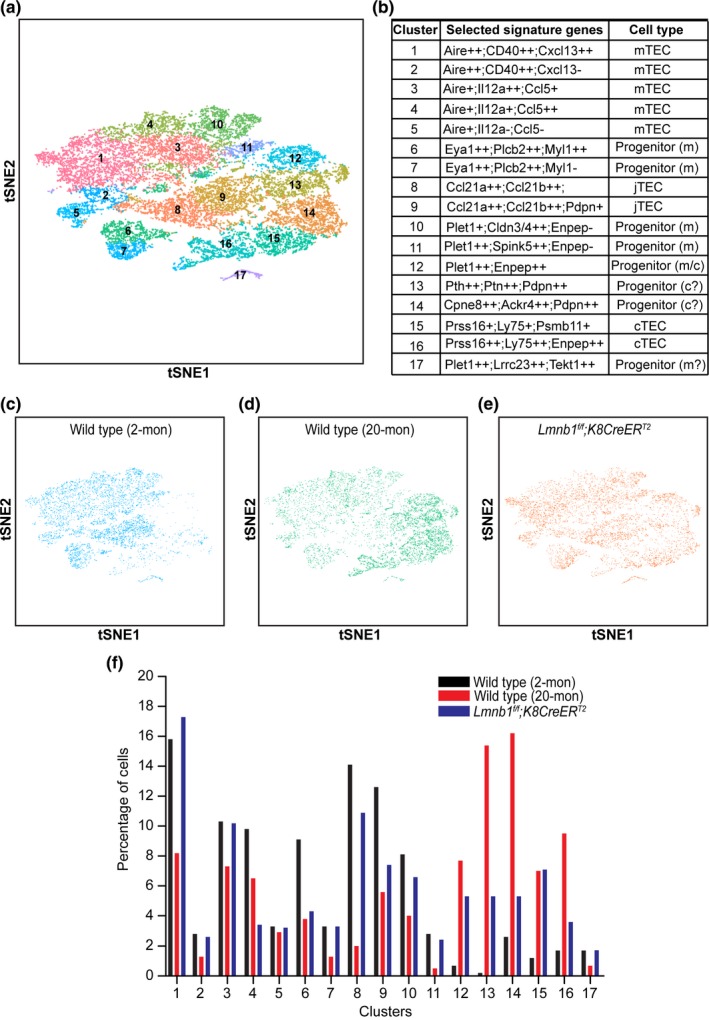
Figure 6.

Single‐cell RNA‐seq of TECs in young, old, and postnatal lamin‐B1‐depleted thymus. (a) t‐Distributed Stochastic Neighbor Embedding (tSNE) plot of combined TECs from WT young (2‐mon; 5,872 cells), WT old (20‐mon; 6,973 cells), and TAM‐treated Lmnb1f/f;K8CreERT2 (7,314 cells) mouse thymuses. Cell clusters are assigned to specific subgroups (1–17) based on differentially expressed marker genes. Each point is a single cell colored by cluster assignment. (b) List of selected marker genes and predicted subpopulations of individual TEC clusters. +: 2 ≤ fold change <3; ++: fold change ≥3; −: not enriched. (c–e) tSNE plots of TECs derived from WT young (c), WT old (d), and TAM‐treated Lmnb1f/f;K8CreERT2(e) mouse thymuses. Each point is a single cell colored by cluster assignment. (f) Percentage of the 17 TEC clusters shown in b in WT young, WT old, and TAM‐treated Lmnb1f/f;K8CreERT2 mice
