Figure 2.

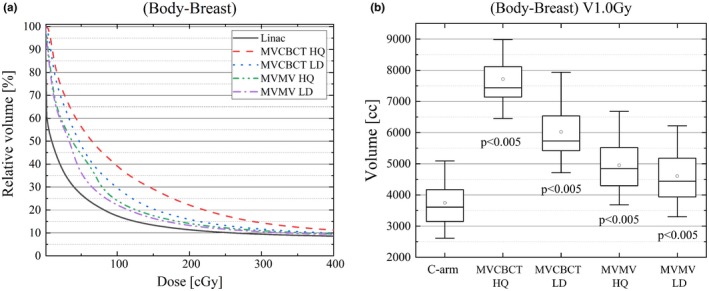
(a) Low‐dose region of the cumulative DVH of (Body‐Breast) over 25 fractions for the C‐arm and Halcyon plans. (b) Box plot showing the (Body‐Breast) V1.0Gy [cc], significant differences were observed when comparing C‐arm and Halcyon plans.

(a) Low‐dose region of the cumulative DVH of (Body‐Breast) over 25 fractions for the C‐arm and Halcyon plans. (b) Box plot showing the (Body‐Breast) V1.0Gy [cc], significant differences were observed when comparing C‐arm and Halcyon plans.